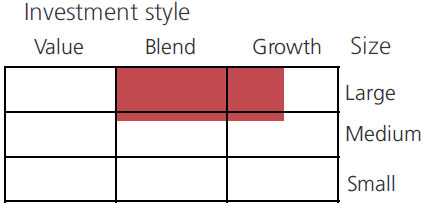
Large cap fund - An open-ended equity scheme predominantly investing in large cap stocks
Large cap fund - An open-ended equity scheme predominantly investing in large cap stocks
 |
 |
 
|
|
|
|
| Issuer/Instrument | Industry/ Rating |
% to Net Assets |
|---|---|---|
| Equity & Equity related |
||
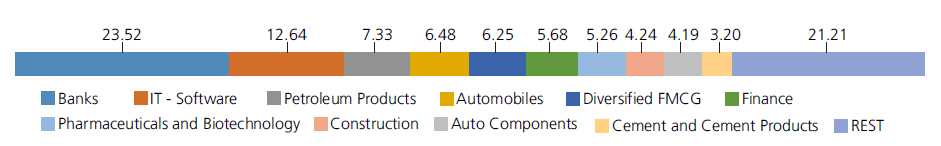
| Banks | 23.52 | |
| ICICI Bank Ltd. | 7.46 | |
| HDFC Bank Ltd. | 6.62 | |
| Axis Bank Ltd. | 3.68 | |
| State Bank Of India | 2.67 | |
| Kotak Mahindra Bank Ltd. | 2.10 | |
| Bank Of Baroda | 0.75 | |
| AU Small Finance Bank Ltd. | 0.24 | |
| IT - Software | 12.64 | |
| Infosys Ltd. | 4.50 | |
| Tata Consultancy Services Ltd. | 2.96 | |
| Persistent Systems Limited | 2.03 | |
| LTIMindtree Limited | 1.14 | |
| Tech Mahindra Ltd. | 1.13 | |
| HCL Technologies Ltd. | 0.88 | |
| Petroleum Products | 7.33 | |
| RELIANCE INDUSTRIES LTD. | 6.10 | |
| Bharat Petroleum Corporation Ltd. | 1.23 | |
| Automobiles | 6.48 | |
| Maruti Suzuki India Limited | 2.87 | |
| Mahindra & Mahindra Ltd. | 2.33 | |
| Eicher Motors Ltd. | 1.28 | |
| Diversified FMCG | 6.25 | |
| ITC Ltd. | 4.30 | |
| Hindustan Unilever Ltd. | 1.95 | |
| Finance | 5.68 | |
| HDFC Ltd. | 3.40 | |
| Bajaj Finance Ltd. | 1.53 | |
| SBI Cards & Payment Services Pvt. Ltd. | 0.75 | |
| Pharmaceuticals and Biotechnology | 5.26 | |
| Sun Pharmaceuticals Industries Ltd. | 1.74 | |
| Dr Reddys Laboratories Ltd. | 1.55 | |
| Zydus Lifesciences Limited | 1.20 | |
| Gland Pharma Limited | 0.77 | |
| Construction | 4.24 | |
| Larsen And Toubro Ltd. | 4.24 | |
| Auto Components | 4.19 | |
| Bosch Ltd. | 1.32 | |
| Apollo Tyres Ltd. | 1.14 | |
| Schaeffler India Ltd | 0.78 | |
| Samvardhana Motherson International Limited | 0.68 | |
| Motherson Sumi Wiring India Limited | 0.27 | |
| Cement and Cement Products | 3.20 | |
| Ultratech Cement Ltd. | 2.44 | |
| Shree Cement Ltd. | 0.69 | |
| The Ramco Cements Ltd | 0.07 | |
| Transport Services | 2.37 | |
| Inter Globe Aviation Ltd | 1.33 | |
| Container Corporation of India Ltd. | 1.04 | |
| Beverages | 2.22 | |
| United Breweries Ltd. | 1.12 | |
| United Spirits Ltd. | 1.10 | |
| Gas | 2.20 | |
| Indraprastha Gas Ltd. | 1.21 | |
| Gujarat State Petronet Ltd. | 0.99 | |
| Consumer Durables | 2.16 | |
| Titan Company Ltd. | 1.31 | |
| V-Guard Industries Ltd. | 0.85 | |
| Telecom - Services | 2.10 | |
| Bharti Airtel Ltd | 2.03 | |
| Bharti Airtel Ltd - Partly Paid Shares | 0.07 | |
| Personal Products | 1.49 | |
| Godrej Consumer Products Ltd. | 1.49 | |
| Industrial Products | 1.40 | |
| Bharat Forge Ltd. | 1.40 | |
| Non - Ferrous Metals | 1.38 | |
| Hindalco Industries Ltd | 1.38 | |
| Insurance | 1.15 | |
| HDFC Life Insurance Company Ltd. | 0.86 | |
| Life Insurance Corporation Of India Ltd. | 0.29 | |
| Fertilizers and Agrochemicals | 1.06 | |
| Coromandel International Ltd. | 1.06 | |
| Realty | 1.06 | |
| Oberoi Realty Ltd | 0.65 | |
| Mahindra Lifespace Developers Ltd | 0.41 | |
| Chemicals and Petrochemicals | 0.75 | |
| Solar Industries India Limited | 0.75 | |
| Retailing | 0.39 | |
| FSN E-Commerce Ventures Ltd. | 0.37 | |
| Zomato Ltd. | 0.02 | |
| Financial Technology (Fintech) | 0.01 | |
| PB Fintech Ltd. | 0.01 | |
| Equity & Equity related - Total | 98.53 | |
| Triparty Repo | 0.39 | |
| Net Current Assets/(Liabilities) | 1.08 | |
| Grand Total | 100.00 | |
| | ||
Term Deposit as provided above is towards margin for derivatives transactions
Note: Large Cap, Midcap, Small cap and Debt and Money Market stocks as a % age of Net Assets: 82.54, 13.74, 2.25 & 1.47
| Monthly SIP of (₹) 10000 | Since Inception | 10 years | 7 years | 5 years | 3 years | 1 year |
| Total amount invested (₹) | 24,30,000 | 12,00,000 | 8,40,000 | 6,00,000 | 3,60,000 | 1,20,000 |
| Total Value as on Apr 28, 2023 (₹) | 1,25,89,360 | 22,96,815 | 13,07,391 | 8,41,431 | 4,36,008 | 1,24,564 |
| Scheme Returns (%) | 14.28 | 12.49 | 12.45 | 13.54 | 12.93 | 7.26 |
| Nifty 100 (TRI) Returns (%) | 13.80 | 12.65 | 12.72 | 13.21 | 12.93 | 5.07 |
| Alpha | 0.49 | -0.16 | -0.27 | 0.34 | 0.00 | 2.19 |
| Nifty 100 (TRI) (₹)# | 1,18,47,548 | 23,17,012 | 13,20,087 | 8,34,468 | 4,35,993 | 1,23,200 |
| Nifty 50 (TRI) Returns (%) | 13.60 | 13.00 | 13.56 | 14.18 | 14.40 | 8.49 |
| Alpha | 0.68 | -0.51 | -1.11 | -0.63 | -1.47 | -1.23 |
| Nifty 50 (TRI) (₹)# | 1,15,67,089 | 23,60,239 | 13,60,020 | 8,54,658 | 4,45,256 | 1,25,330 |
| S&P BSE SENSEX (TRI) (₹)^ | 1,18,93,759 | 24,06,021 | 13,86,566 | 8,60,159 | 4,46,608 | 1,26,035 |
| S&P BSE SENSEX (TRI) Returns (%) | 13.83 | 13.36 | 14.10 | 14.44 | 14.61 | 9.63 |
| Reg-Plan-IDCW | Rs49.5680 |
| Dir-Plan-IDCW | Rs56.9230 |
| Growth option | Rs384.0010 |
| Direct Growth option | Rs430.4110 |
A) Regular Plan B) Direct Plan
Options: Payout of IDCW, Reinvestment of
IDCW & Growth (applicable for all plans)
| Fund Manager* | Mr. Harish Krishnan & Mr. Arjun Khanna (Dedicated fund manager for investments in foreign securities) |
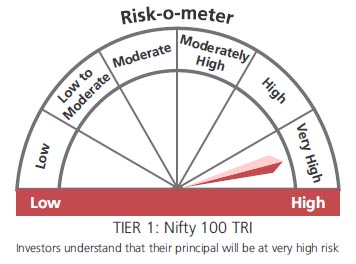
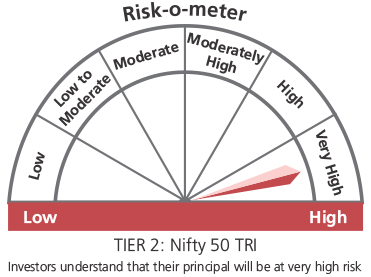
| Benchmark*** | Nifty 100 TRI (Tier 1) Nifty 50 TRI (Tier 2) |
| Allotment date | December 29, 1998 |
| AAUM | Rs5,495.51 crs |
| AUM | Rs5,633.29 crs |
| Folio count | 3,16,750 |
Trustee's Discretion
| Portfolio Turnover | 13.51% |
| $Beta | 0.90 |
| $Sharpe ## | 1.06 |
| $Standard Deviation | 13.88% |
| (P/E) | 25.80 |
| P/BV | 3.62 |
| IDCW Yield | 1.03 |
Initial Investment: Rs1000 and in multiple of
Rs1 for purchase and for Rs0.01 for switches
Additional Investment: Rs1000 & in multiples
of Rs1
Ideal Investments Horizon: 5 years & above
Entry Load: Nil. (applicable for all plans)
Exit Load:
a) For redemption / switch out of upto 10%
of the initial investment amount (limit)
purchased or switched in within 1 year from
the date of allotment: Nil.
b) If units redeemed or switched out are in
excess of the limit within 1 year from the
date of allotment: 1%
c) If units are redeemed or switched out on
or after 1 year from the date of allotment:
NIL
Regular: 1.81%; Direct: 0.54%
Benchmark
Benchmark
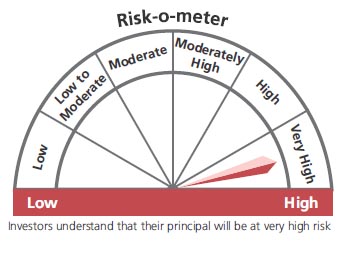
This product is suitable for investors who are seeking*:
- Long term capital growth
- Investment in portfolio of predominantly equity & equity related securities of large cap companies
* Investors should consult their financial advisers if in doubt about whether the product is suitable for them.
The above risk-o—meter is based on the scheme portfolio as on 30th April, 2023. An addendum may be issued or updated on the website for new riskometer.
***As per SEBI Circular dated 27th October 2021 The first tier benchmark is reflective of the category of the scheme and the second tier benchmark is demonstrative of the investment style / strategy of the Fund Manager within the category.
## Risk rate assumed to be 6.90% (FBIL Overnight MIBOR rate as on 28th April 2023).**Total Expense Ratio includes applicable B30 fee and GST.
* For Fund Manager experience, please refer 'Our Fund Managers'
For last three IDCW, please refer 'Dividend History'.
For scheme performance, please refer 'Scheme Performances'