| KOTAK NIFTY PSU BANK ETF
An open-ended scheme replicating/ tracking nifty PSU bank index
NSE Symbol - KOTAKPSUBK
BSE Scrip Code - 590107
An open-ended scheme replicating/ tracking nifty PSU bank index
NSE Symbol - KOTAKPSUBK
BSE Scrip Code - 590107
| KOTAK NIFTY PSU BANK ETF
An open-ended scheme replicating/ tracking nifty PSU bank index
NSE Symbol - KOTAKPSUBK
BSE Scrip Code - 590107
An open-ended scheme replicating/ tracking nifty PSU bank index
NSE Symbol - KOTAKPSUBK
BSE Scrip Code - 590107
 
|
|
|
Investment Objective
The investment objective of the scheme is
to provide returns that closely correspond
to the total returns of Nifty PSU Bank Index,
subject to tracking errors. However, there is
no assurance or guarantee that the
investment objective of the scheme will be
achieved.
The investment objective of the scheme is
to provide returns that closely correspond
to the total returns of Nifty PSU Bank Index,
subject to tracking errors. However, there is
no assurance or guarantee that the
investment objective of the scheme will be
achieved.
| Issuer/Instrument | Industry/ Rating |
% to Net Assets |
|---|---|---|
| Equity & Equity Related |
||
| State Bank Of India | Banks | 28.32 |
| Bank Of Baroda | Banks | 20.22 |
| Punjab National Bank | Banks | 12.35 |
| Canara Bank | Banks | 12.33 |
| Union Bank Of India | Banks | 7.53 |
| Indian Bank | Banks | 6.86 |
| Bank of India | Banks | 5.60 |
| Indian Overseas Bank | Banks | 1.67 |
| Central Bank Of India | Banks | 1.58 |
| Bank of Maharashtra | Banks | 1.56 |
| UCO Bank | Banks | 1.54 |
| Punjab & Sind Bank | Banks | 0.42 |
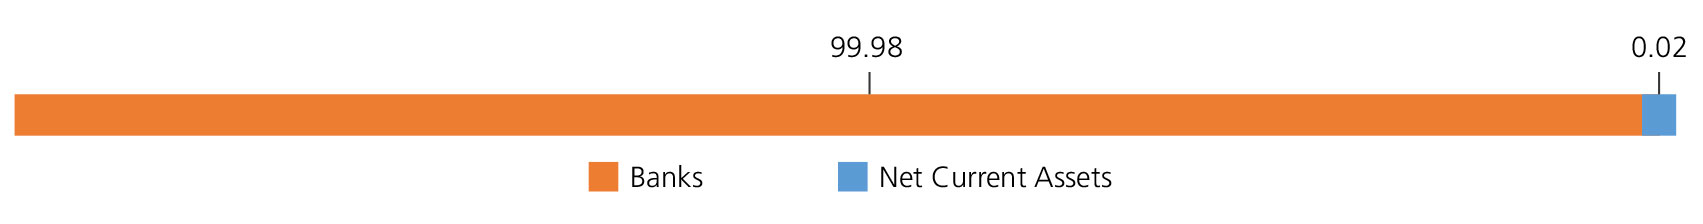
| Equity & Equity Related - Total | 99.98 | |
| Net Current Assets/(Liabilities) | 0.02 | |
| Grand Total | 100.00 | |
NAV
Rs413.1494
Available Plans/Options
Regular Plan
| Fund Manager* | Mr. Devender Singhal & Mr. Satish Dondapati |
| Benchmark | Nifty PSU Bank TRI |
| Allotment date | November 8, 2007 |
| AAUM | Rs1,047.75 crs |
| AUM | Rs1,121.59 crs |
| Folio count | 6,741 |
Ratios
| Portfolio Turnover | 90.40% |
| Tracking Error: | 0.13% |
Minimum Investment Amount
Through Exchange: 10 Unit,
Through AMC: 10000 Units,
Ideal Investments Horizon: 5 years and
above
Load Structure
Entry Load: Nil. (applicable for all plans)
Exit Load:
Nil (applicable for all plans)
Total Expense Ratio**
Regular:0.49%
Data as on April 30, 2023
Fund
Benchmark
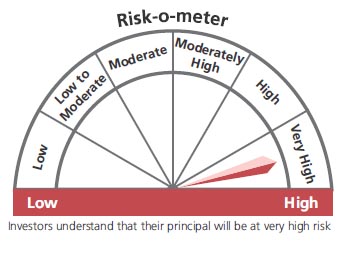
This product is suitable for investors who are seeking*:
- Long term capital growth
- Investment in stocks comprising the underlying index and endeavours to track the benchmark index
* Investors should consult their financial advisers if in doubt about whether the product is suitable for them.
The above risk-o—meter is based on the scheme portfolio as on 30th April, 2023. An addendum may be issued or updated on the website for new riskometer.
**Total Expense Ratio includes applicable B30 fee and GST.
* For Fund Manager experience, please refer 'Our Fund Managers'
For last three IDCW, please refer 'Dividend History'.
For scheme performance, please refer 'Scheme Performances'