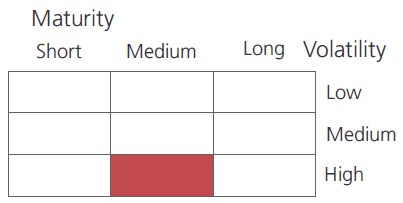
An open ended debt scheme predominantly investing in AA and below rated corporate bonds (Excluding AA+ rated corporate bonds).
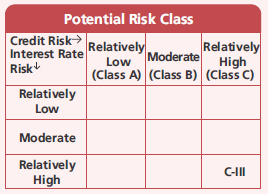
A relatively high interest rate risk and relatively high credit risk.
An open ended debt scheme predominantly investing in AA and below rated corporate bonds (Excluding AA+ rated corporate bonds).
A relatively high interest rate risk and relatively high credit risk.
 |
 |
 
|
|
|
|
| Issuer/Instrument | Industry/ Rating |
% to Net Assets |
|---|---|---|
| Mutual Fund Units | ||
| Mutual Fund Units - Total | 3.86 | |
| Embassy Office Parks REIT | Realty | 2.24 |
| Brookfield India Real Estate Trust | Realty | 1.21 |
| Mindspace Business Parks REIT | Realty | 0.41 |
| Debt Instruments | ||
| Debentures and Bonds | ||
| Government Dated Securities | ||
| 5.53% Central Government(^) | SOV | 4.11 |
| 7.86% Karnataka State Govt-Karnataka | SOV | 3.07 |
| 6.12% Karnataka State Govt-Karnataka | SOV | 2.84 |
| Government Dated Securities - Total | 10.02 | |
| Public Sector Undertakings | ||
| Punjab & Sind Bank(Basel III TIER I Bonds) | ICRA A- | 6.87 |
| Power Finance Corporation Ltd. | CRISIL AAA | 3.89 |
| U P Power Corporation Ltd ( Guaranteed By UP State Government ) | CRISIL A+(CE) | 3.54 |
| THDC India Ltd. (THDCIL) | CARE AA | 1.50 |
| Punjab National Bank(Basel III TIER II Bonds)(^) | CRISIL AA+ | 0.30 |
| Public Sector Undertakings - Total | 16.10 | |
| Corporate Debt/Financial Institutions | ||
| Coastal Gujarat Power Ltd. ( Guarenteed by TATA Power Co. Ltd ) (^) | CARE AA(CE) | 6.55 |
| Godrej Properties Limited(^) | ICRA AA | 5.99 |
| Century Textiles & Industries Ltd. | CRISIL AA | 5.89 |
| Aadhar Housing Finance Limited | CARE AA | 5.87 |
| DLF Cyber City Developers Ltd (^) | CRISIL AA | 5.81 |
| Bahadur Chand Investments Private Limited | ICRA AA | 4.46 |
| Bajaj Housing Finance Ltd. | CRISIL AAA | 4.39 |
| Prestige Projects Pvt. Ltd | ICRA A+(CE) | 4.09 |
| Godrej Industries Ltd | CRISIL AA | 3.54 |
| Godrej Industries Ltd | CRISIL AA | 1.77 |
| Tata Projects Ltd. | FITCH IND AA | 1.46 |
| Muthoot Finance Ltd. | CRISIL AA+ | 0.89 |
| Muthoot Finance Ltd. | CRISIL AA+ | 0.79 |
| Jamnagar Utilities & Power Private Limited ( Mukesh Ambani Group ) | CRISIL AAA | 0.61 |
| LIC Housing Finance Ltd. | CRISIL AAA | 0.05 |
| Corporate Debt/Financial Institutions - Total | 52.16 | |
| Money Market Instruments | ||
| Commercial Paper(CP)/Certificate of Deposits(CD) | ||
| Treasury Bills | ||
| 182 Days Treasury Bill 04/08/2022 | SOV | 4.39 |
| Treasury Bills - Total | 4.39 | |
| Corporate Debt/Financial Institutions | ||
| Vedanta Ltd. | CRISIL A1+ | 2.79 |
| Corporate Debt/Financial Institutions - Total | 2.79 | |
| Triparty Repo | 11.35 | |
| Net Current Assets/(Liabilities) | -0.67 | |
| Grand Total | 100.00 | |
| Monthly SIP of (₹) 10000 | Since Inception | 10 years | 7 years | 5 years | 3 years | 1 year |
| Total amount invested (Rs) | 14,40,000 | 12,00,000 | 8,40,000 | 6,00,000 | 3,60,000 | 1,20,000 |
| Total Value as on Apr 30, 2022 (Rs) | 22,56,062 | 17,07,596 | 10,40,393 | 6,87,304 | 3,83,927 | 1,19,925 |
| Scheme Returns (%) | 7.21 | 6.87 | 6.03 | 5.39 | 4.24 | -0.12 |
| NIFTY Credit Risk Bond Index CIII Returns (%) | 9.30 | 9.15 | 8.75 | 8.67 | 8.46 | 6.39 |
| Alpha | -2.09 | -2.28 | -2.72 | -3.28 | -4.21 | -6.51 |
| NIFTY Credit Risk Bond Index CIII (Rs)# | 25,81,174 | 19,24,618 | 11,46,131 | 7,46,059 | 4,08,690 | 1,24,039 |
| NIFTY Credit Risk Bond Index Returns (%) | 9.03 | 8.87 | 8.54 | 8.51 | 8.29 | 5.95 |
| Alpha | -1.82 | -2.00 | -2.51 | -3.12 | -4.05 | -6.06 |
| NIFTY Credit Risk Bond Index (Rs)# | 25,36,590 | 18,96,922 | 11,37,526 | 7,43,024 | 4,07,724 | 1,23,760 |
| CRISIL 10 Year Gilt Index (Rs)^ | 20,91,057 | 16,20,416 | 10,01,030 | 6,67,566 | 3,68,767 | 1,17,498 |
| CRISIL 10 Year Gilt Index (%) | 6.02 | 5.86 | 4.95 | 4.23 | 1.58 | -3.90 |
Alpha is difference of scheme return with benchmark return.
| Growth Option | Rs24.1524 |
| Direct Growth Option | Rs26.3632 |
| Annual-Reg-Plan-IDCW | Rs10.5035 |
| Annual-Dir-Plan-IDCW | Rs19.8013 |
A) Regular Plan B) Direct Plan
Options: Payout of IDCW, Reinvestment of
IDCW & Growth (applicable for all plans)
| Fund Manager | Mr. Deepak Agrawal &
Mr. Vihag Mishra* (Dedicated fund manager for investments in foreign securities) |
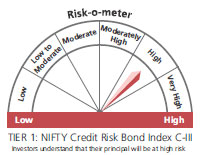
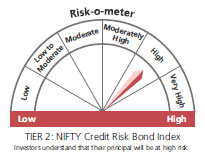
| Benchmark*** | Nifty Credit Risk Bond Index C-III (Tier 1) Nifty Credit Risk Bond |
| Allotment date | May 11, 2010 |
| AAUM | Rs1,727.70 crs |
| AUM | Rs1,690.20 crs |
| Folio count | 14,368 |
At discretion of trustees
| Portfolio Average Maturity | 2.46 yrs |
| IRS Average Maturity* | 0.06 yrs |
| Net Average Maturity | 2.52 yrs |
| Portfolio Modified Duration | 1.61 yrs |
| IRS Modified Duration* | 0.05 yrs |
| Net Modified Duration | 1.66 yrs |
| Portfolio Macaulay Duration | 1.71 yrs |
| IRS Macaulay Duration* | 0.05 yrs |
| Net Macaulay Duration | 1.76 yrs |
| YTM | 6.44% |
| $Standard Deviation | 2.66% |
Initial Investment:Rs5000 and in multiple
of Rs1 for purchase and for Rs0.01 for switches
Additional Investment: Rs1000 & in multiples of Rs1
Ideal Investments Horizon: 3 year & above
Entry Load: Nil. (applicable for all plans)
Exit Load: a) For redemption / switch out of
upto 6% of the initial investment amount
(limit) purchased or switched in within 1
year from the date of allotment: Nil.
b) If units redeemed or switched out are in
excess of the limit within 1 year from the
date of allotment: 1%
c) If units are redeemed or switched out on
or after 1 year from the date of allotment:
NIL
Regular: 1.72%; Direct: 0.74%
Fund
Benchmark
Benchmark
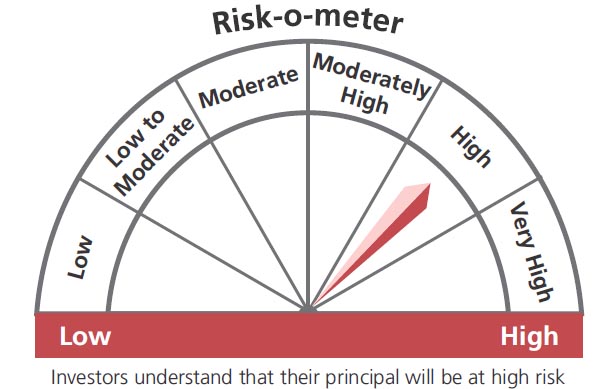
This product is suitable for investors who are seeking*:
- Income over a medium term investment horizon
- Investment predominantly in in AA and below rated corporate bonds (Excluding AA+ rated corporate bonds)
* Investors should consult their financial advisers if in doubt about whether the product is suitable for them.
(^) Fully or Party blocked against Interest Rate Swap (IRS) Hedging Position through Interest Rate Swaps as on 30 Apr 2022 is 7.40% of the net assets.
**Total Expense Ratio includes applicable B30 fee and GST.
***As per SEBI circular no. SEBI/HO/IMD/IMD-11 DF3/P/CIR/2021 /652 dated October 27, 2021; AMFI letter no. 35P/MEM-COR/70/2021-22 dated November 25, 2021 and AMFI letter no. 35P/ MEM-COR/ 131 / 2021-22 dated March 31, 2022 with effect from April 01, 2022 ("Effective date"), the first tier benchmark index of the scheme. Existing benchmark will be Second Tier benchmark for aforementioned scheme.
* For Fund Manager experience, please refer 'Our Fund Managers'
For last three IDCW, please refer 'Dividend History'.
For scheme performance, please refer 'Scheme Performances'