| KOTAK MONEY MARKET FUND
An open ended debt scheme investing in money market instruments
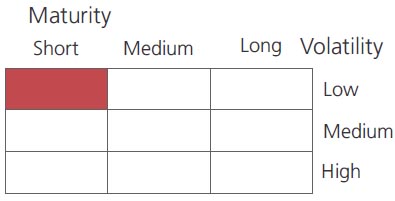
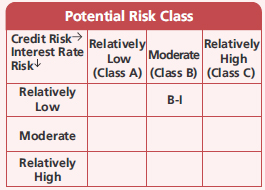
A relatively low interest rate risk and moderate credit risk
An open ended debt scheme investing in money market instruments
A relatively low interest rate risk and moderate credit risk
| KOTAK MONEY MARKET FUND
An open ended debt scheme investing in money market instruments
A relatively low interest rate risk and moderate credit risk
*Interest Rate Swap
Source: $ICRAMFI Explorer. Standard
Deviation is calculated on Annualised basis
using 3 years history of monthly returns.
This product is suitable for investors who are seeking*:
***As per SEBI circular no. SEBI/HO/IMD/IMD-11 DF3/P/CIR/2021 /652 dated October 27, 2021; AMFI letter no. 35P/MEM-COR/70/2021-22 dated November 25, 2021 and AMFI letter no. 35P/ MEM-COR/ 131 / 2021-22 dated March 31, 2022 with effect from April 01, 2022 ("Effective date"), the first tier benchmark index of the scheme. Existing benchmark will be Second Tier benchmark for aforementioned scheme.
* For Fund Manager experience, please refer 'Our Fund Managers'
For last three IDCW, please refer 'Dividend History'.
For scheme performance, please refer 'Scheme Performances'
An open ended debt scheme investing in money market instruments
A relatively low interest rate risk and moderate credit risk
 |
 |
 
|
|
|
|
Investment Objective
The investment objective of the Scheme is
to generate returns by investing in money
market instruments having maturity upto 1
year. There is no assurance that the
investment objective of the Scheme will be
realised.
The investment objective of the Scheme is
to generate returns by investing in money
market instruments having maturity upto 1
year. There is no assurance that the
investment objective of the Scheme will be
realised.
| Issuer/Instrument | Industry/ Rating |
% to Net Assets |
|---|---|---|
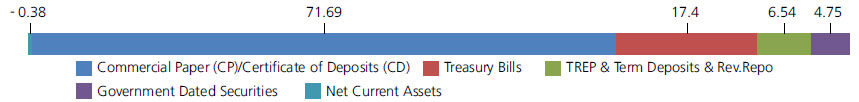
| Government Dated Securities | ||
| 8.08% Central Government | SOV | 3.83 |
| 8.92% Punjab State Govt-Punjab | SOV | 0.59 |
| 8.91% Punjab State Govt-Punjab | SOV | 0.33 |
| Government Dated Securities - Total | 4.75 | |
| Money Market Instruments | ||
| Commercial Paper(CP)/Certificate of Deposits(CD) | ||
| Corporate Debt/Financial Institutions | ||
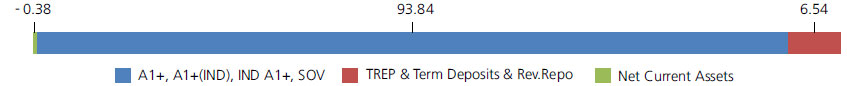
| HDFC Ltd. | CRISIL A1+ | 9.27 |
| AXIS Bank Ltd. | CRISIL A1+ | 8.91 |
| HDFC Bank Ltd. | CARE A1+ | 7.05 |
| Bharti Airtel Ltd. | CRISIL A1+ | 3.24 |
| Reliance Retail Ventures Ltd | CRISIL A1+ | 3.20 |
| Tata Motors Finance Ltd. | ICRA A1+ | 2.83 |
| Piramal Enterprises Ltd. | CRISIL A1+ | 2.79 |
| Panatone Finvest Ltd. | CRISIL A1+ | 2.21 |
| Sikka Ports & Terminals Ltd. | CRISIL A1+ | 1.96 |
| Vedanta Ltd. | CRISIL A1+ | 1.69 |
| LIC Housing Finance Ltd. | CRISIL A1+ | 1.30 |
| Fullerton India Credit Co. Ltd. | CRISIL A1+ | 1.29 |
| Edelweiss Finance & Investments Limited | CRISIL A1+ | 0.97 |
| ICICI Securities Limited | CRISIL A1+ | 0.97 |
| JSW Steel Ltd. | ICRA A1+ | 0.97 |
| Tata Motors Ltd. | CRISIL A1+ | 0.97 |
| IndusInd Bank Ltd. | CRISIL A1+ | 0.96 |
| Deutsche Bank | CRISIL A1+ | 0.94 |
| JSW Energy Ltd. | FITCH A1+(IND) | 0.65 |
| AU Small Finance Bank Ltd. | FITCH A1+(IND) | 0.64 |
| Can Fin Homes Ltd. | CRISIL A1+ | 0.64 |
| Daimler Financial Services India | CRISIL A1+ | 0.64 |
| Hero FinCorp Ltd. | CRISIL A1+ | 0.64 |
| JM Financial Products Limited | CRISIL A1+ | 0.64 |
| L & T Finance Ltd. | CRISIL A1+ | 0.64 |
| SBICAP Securities Limited | CRISIL A1+ | 0.64 |
| AU Small Finance Bank Ltd. | FITCH IND A1+ | 0.62 |
| Bajaj Financial Securities Limited | CRISIL A1+ | 0.62 |
| Crompton Greaves Consumer Electricals Limited | CRISIL A1+ | 0.51 |
| Standard Chartered Capital Ltd. | CRISIL A1+ | 0.48 |
| Bajaj Housing Finance Ltd. | CRISIL A1+ | 0.32 |
| Kec International Ltd. | CRISIL A1+ | 0.32 |
| Northern Arc Capital Limited | ICRA A1+ | 0.32 |
| Fed Bank Financial Services Limited | CRISIL A1+ | 0.31 |
| Jamnagar Utilities & Power Private Limited | CRISIL A1+ | 0.03 |
| Corporate Debt/Financial Institutions - Total | 60.18 | |
| Public Sector Undertakings | ||
| National Bank for Agriculture & Rural Development | CRISIL A1+ | 3.12 |
| Small Industries Development Bank Of India | CARE A1+ | 2.34 |
| National Bank for Agriculture & Rural Development | ICRA A1+ | 2.08 |
| Bank Of Baroda | FITCH A1+(IND) | 1.91 |
| Canara Bank | CRISIL A1+ | 0.97 |
| SBI Cards & Payment Services Pvt. Ltd. | CRISIL A1+ | 0.96 |
| Indian Bank | CRISIL A1+ | 0.13 |
| Public Sector Undertakings - Total | 11.51 | |
| Treasury Bills | ||
| 182 Days Treasury Bill 15/09/2022 | SOV | 8.58 |
| 182 Days Treasury Bill 08/09/2022 | SOV | 4.99 |
| 182 Days Treasury Bill 22/09/2022 | SOV | 1.43 |
| 182 Days Treasury Bill 25/08/2022 | SOV | 1.28 |
| 182 Days Treasury Bill 01/09/2022 | SOV | 0.64 |
| 182 Days Treasury Bill 04/08/2022 | SOV | 0.48 |
| Treasury Bills - Total | 17.40 | |
| Triparty Repo | 6.54 | |
| Net Current Assets/(Liabilities) | -0.38 | |
| Grand Total | 100.00 | |
| Monthly SIP of (₹) 10000 | Since Inception | 10 years | 7 years | 5 years | 3 years | 1 year |
| Total amount invested (Rs) | 22,60,000 | 12,00,000 | 8,40,000 | 6,00,000 | 3,60,000 | 1,20,000 |
| Total Value as on Apr 30, 2022 (Rs) | 46,72,345 | 16,83,580 | 10,37,378 | 6,88,554 | 3,85,121 | 1,22,541 |
| Scheme Returns (%) | 7.18 | 6.60 | 5.95 | 5.46 | 4.45 | 4.01 |
| Nifty Money Market Index BI Returns (%) | 7.24 | 6.31 | 5.55 | 5.01 | 4.09 | 3.74 |
| Alpha | -0.06 | 0.29 | 0.40 | 0.46 | 0.36 | 0.26 |
| Nifty Money Market Index BI (Rs)# | 47,00,291 | 16,58,655 | 10,22,832 | 6,80,708 | 3,83,044 | 1,22,376 |
| Nifty Money Market Index Returns (%) | 7.23 | 6.35 | 5.62 | 5.09 | 4.19 | 3.82 |
| Alpha | -0.05 | 0.25 | 0.33 | 0.37 | 0.26 | 0.19 |
| Nifty Money Market Index (Rs)# | 46,95,696 | 16,61,807 | 10,25,127 | 6,82,124 | 3,83,608 | 1,22,420 |
| CRISIL 1 Year T-Bill Index (Rs)^ | 41,98,987 | 16,44,178 | 10,26,281 | 6,85,081 | 3,84,361 | 1,22,375 |
| CRISIL 1 Year T-Bill Index Returns (%) | 6.18 | 6.14 | 5.65 | 5.26 | 4.32 | 3.74 |
Scheme Inception : - July 14, 2003. The returns are calculated by XIRR approach assuming investment of ₹10,000/- on the 1st working day of every month. XIRR helps in calculating return on investments given an initial and final
value and a series of cash inflows and outflows and taking the time of investment into consideration. Since inception returns are assumed to be starting from the beginning of the subsequent month from the date of inception. #
Benchmark ; ^ Additional Benchmark.
Alpha is difference of scheme return with benchmark return.
Alpha is difference of scheme return with benchmark return.
NAV
| Growth Option | Rs3,612.4586 |
| Direct Growth Option | Rs3,632.9629 |
| Monthly-Reg-Plan-IDCW | Rs1,053.0027 |
| Monthly-Dir-Plan-IDCW | Rs1,046.7020 |
Available Plans/Options
A) Regular Plan B) Direct Plan
Options: Payout of IDCW (w.e.f May 15,
2017, Under Monthly IDCW option only),
Reinvestment of IDCW & Growth
(applicable for all plans)
| Fund Manager | Mr. Deepak Agrawal &
Mr. Vihag Mishra* (Dedicated fund manager for investments in foreign securities) |
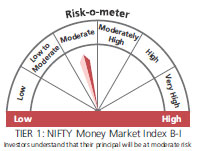
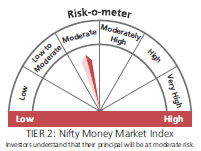
| Benchmark*** | Nifty Money Market Index B-I (Tier 1) Nifty Money Market Index (Tier 2) |
| Allotment date | July 14, 2003 |
| AAUM | Rs13,536.53 crs |
| AUM | Rs12,462.19 crs |
| Folio count | 11,678 |
IDCW Frequency
Monthly (12th of every Month)
Ratios
| Portfolio Average Maturity | 0.37 yrs |
| IRS Average Maturity* | - |
| Net Average Maturity | 0.37 yrs |
| Portfolio Modified Duration | 0.37 yrs |
| IRS Modified Duration* | - |
| Net Modified Duration | 0.37 yrs |
| Portfolio Macaulay Duration | 0.37 yrs |
| IRS Macaulay Duration* | - |
| Net Macaulay Duration | 0.37 yrs |
| YTM | 4.58% |
| $Standard Deviation | 0.18% |
Minimum Investment Amount
Initial Investment:Rs5000 Under growth,
weekly IDCW and monthly IDCW option & Rs1,00,000 under Daily Reinvestment of
IDCW option,
Additional Investment: Rs1000 & in multiples
of Rs1
Ideal Investment Horizon: 3-6 Months
Load Structure
Entry Load: Nil. (applicable for all plans)
Exit Load:
Nil. (applicable for all plans)
Total Expense Ratio**
Regular: 0.33%; Direct: 0.26%
Data as on April 30, 2022
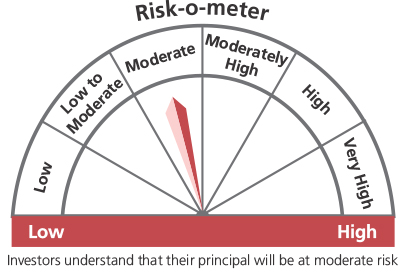
Fund
Benchmark
Benchmark
This product is suitable for investors who are seeking*:
- Income over a short term investment horizon
- Investment in money market securities
* Investors should consult their financial advisers if in doubt about whether the product is suitable for them.
***As per SEBI circular no. SEBI/HO/IMD/IMD-11 DF3/P/CIR/2021 /652 dated October 27, 2021; AMFI letter no. 35P/MEM-COR/70/2021-22 dated November 25, 2021 and AMFI letter no. 35P/ MEM-COR/ 131 / 2021-22 dated March 31, 2022 with effect from April 01, 2022 ("Effective date"), the first tier benchmark index of the scheme. Existing benchmark will be Second Tier benchmark for aforementioned scheme.
* For Fund Manager experience, please refer 'Our Fund Managers'
For last three IDCW, please refer 'Dividend History'.
For scheme performance, please refer 'Scheme Performances'