 
|
|
|
Key Events for the Month of April 2025
• India’s Services Purchasing Managers' Index (PMI) eased slightly to 58.5 in March from 59.0 in February, impacted by
marginally slower sales growth amid softer demand and easing inflationary pressures.
• Manufacturing Purchasing Managers’ Index (PMI) rose to 58.1 in March 2025, up from 56.3 in February, driven by
stronger growth in new orders. The New Orders Index hit an eight-month high, supported by increased customer interest,
favourable demand conditions, and effective marketing initiatives.
• India’s retail inflation (Consumer Price Index - CPI) declined slightly to 3.34% in March, its lowest in nearly six years,
primarily due to falling prices of vegetables and protein-rich food items.
• India’s Wholesale Price Index (WPI) moderated to 2.05% in March from 2.38% in February, mainly influenced by price
movements in manufactured food products, food articles, textiles, electricity, and other manufactured items.
• GST collection reached an all-time high of ₹ 2.36 lakh crore in April 2025, a 12.6% rise over ₹ 2.10 lakh crore collected in
April 2024. The robust double-digit growth in GST indicates strengthening economic activity.
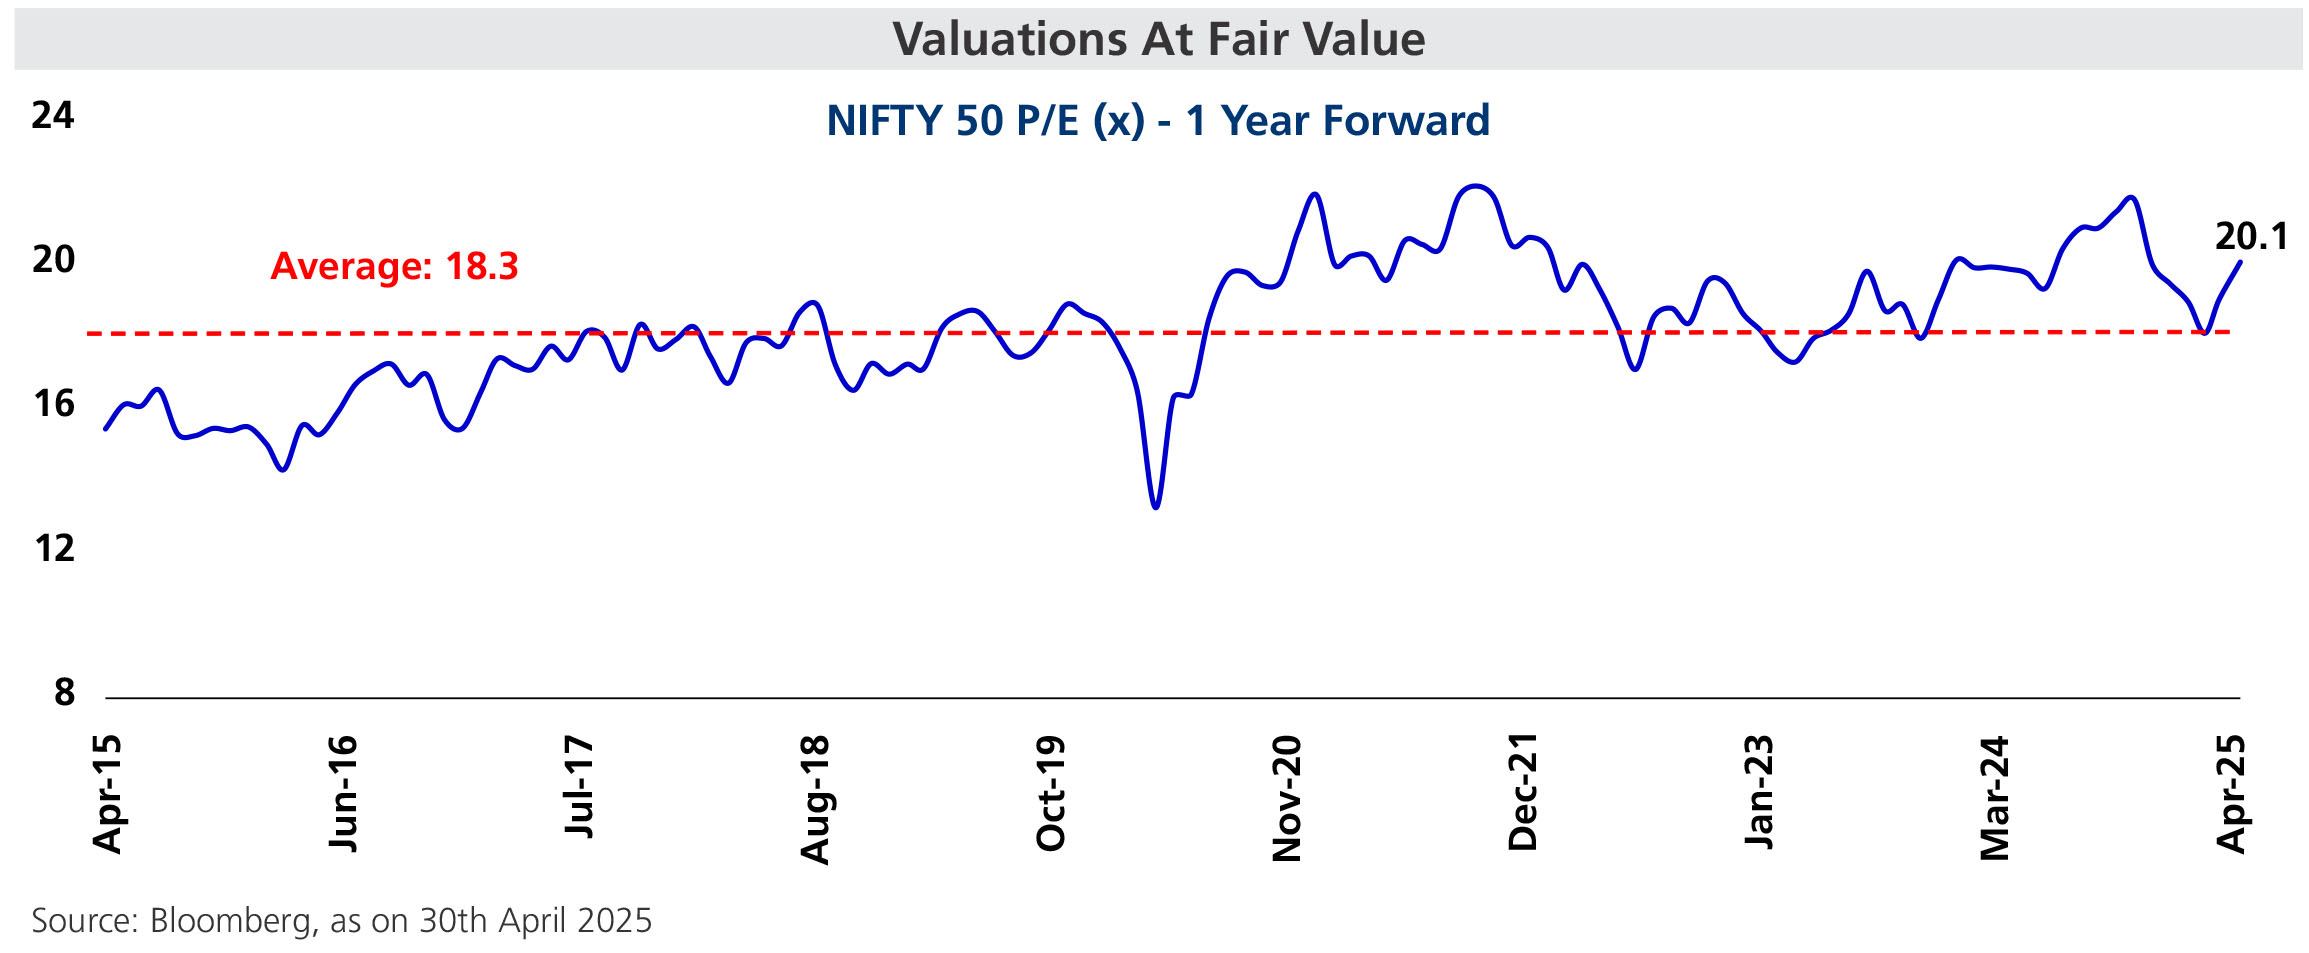
• Indian equity indices posted moderate monthly gains, with the Nifty 50 rising 3.77% and the BSE Sensex climbing
3.65%.
| |
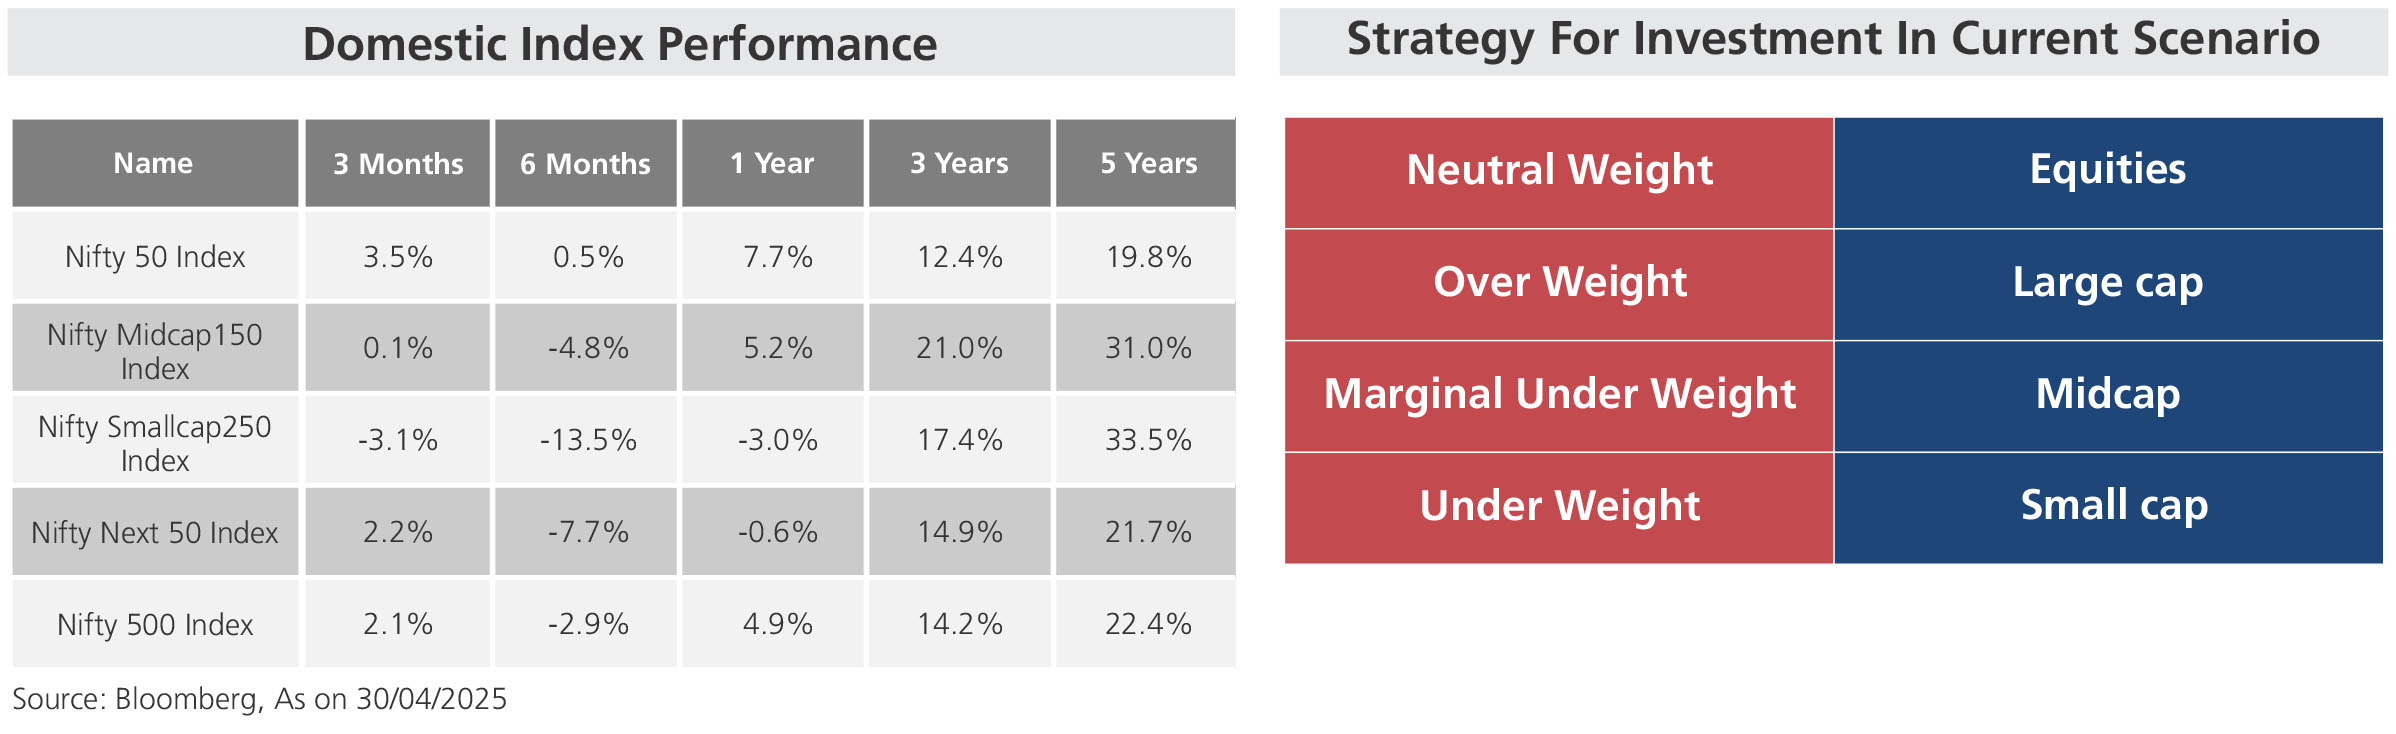
Sectoral Index Performance |
| Name | 3 Months | 6 Months | 1 Year | 3 Years | 5 Years |
| Nifty Auto Index | -2.4% | -5.1% | -0.8% | 26.2% | 30.4% |
| Nifty Bank Index | 11.1% | 7.0% | 11.5% | 15.1% | 20.7% |
| Nifty Energy Index | 1.0% | -12.9% | -15.2% | 6.2% | 21.1% |
| Nifty Financial Services Index | 12.5% | 9.3% | 19.6% | 16.2% | 19.8% |
| Nifty FMCG Index | -0.4% | -4.7% | 4.1% | 13.9% | 14.5% |
| Nifty Healthcare Index | 1.9% | -2.6% | 17.4% | 18.6% | 20.3% |
| Nifty Infrastructure Index | 5.2% | -0.4% | 2.5% | 19.6% | 26.1% |
| Nifty IT Index | -16.1% | -11.4% | 7.8% | 4.2% | 20.5% |
| Nifty Media Index | -4.2% | -25.0% | -20.0% | -11.0% | 5.5% |
| Nifty Metal Index | 2.2% | -8.0% | -6.5% | 10.7% | 35.8% |
| Nifty Pharma Index | 1.6% | -4.2% | 14.8% | 17.3% | 18.5% |
| Nifty Psu Bank Index | 3.6% | -2.7% | -14.0% | 33.3% | 37.6% |
| Nifty Realty Index | -3.9% | -11.4% | -9.0% | 25.9% | 36.4% |
| BSE Consumer Durables Index | -0.7% | -5.3% | 4.1% | 10.4% | 22.8% |
| BSE Industrial Index | -5.3% | -12.7% | -3.6% | 31.7% | 44.0% |
| |
Global Index Performance |
| Name | 3 Months | 6 Months | 1 Year | 3 Years | 5 Years |
| MSCI World Index | -4.7% | 0.2% | 10.6% | 9.3% | 12.2% |
| MSCI Emerging Index | 1.8% | -0.6% | 6.4% | 1.1% | 3.8% |
| MSCI India index | 2.8% | -1.4% | 5.4% | 12.2% | 19.9% |
| Dow Jones Industrial Average Index | -8.7% | -2.6% | 7.5% | 7.2% | 10.8% |
| Nasdaq Composite Index | -11.1% | -3.6% | 11.4% | 12.2% | 14.4% |
| Nikkei 225 Index | -8.9% | -7.8% | -6.1% | 10.3% | 12.3% |
| Shanghai Composite Index | 0.9% | 0.0% | 5.6% | 2.5% | 2.8% |
| Deutsche Boerse AG german Stock Index DAX | 3.5% | 17.9% | 25.5% | 16.8% | 15.7% |