| KOTAK BOND SHORT TERM FUND
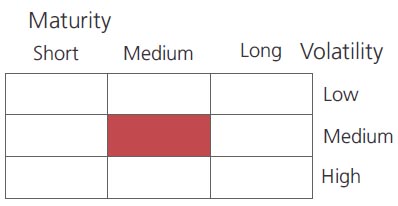
An open ended short term debt scheme investing in instruments such that the Macaulay duration of the portfolio is between 1 year and 3 years
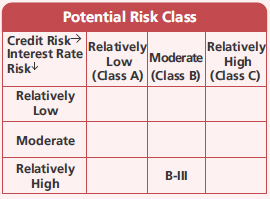
A relatively high interest rate risk and moderate credit risk.
An open ended short term debt scheme investing in instruments such that the Macaulay duration of the portfolio is between 1 year and 3 years
A relatively high interest rate risk and moderate credit risk.
| KOTAK BOND SHORT TERM FUND
An open ended short term debt scheme investing in instruments such that the Macaulay duration of the portfolio is between 1 year and 3 years
A relatively high interest rate risk and moderate credit risk.
An open ended short term debt scheme investing in instruments such that the Macaulay duration of the portfolio is between 1 year and 3 years
A relatively high interest rate risk and moderate credit risk.
 |
 |
 
|
|
|
|
Investment Objective
The investment objective of the Scheme is
to provide reasonable returns and
reasonably high levels of liquidity by
investing in debt instruments such as
bonds, debentures and Government
securities; and money market instruments
such as treasury bills, commercial papers,
certificates of deposit, including repos in
permitted securities of different maturities,
so as to spread the risk across different kinds
of issuers in the debt markets. There is no
assurance that the investment objective of
the Scheme will be realised.
| Issuer/Instrument | Industry/ Rating |
% to Net Assets |
|---|---|---|
| Debt Instruments | ||
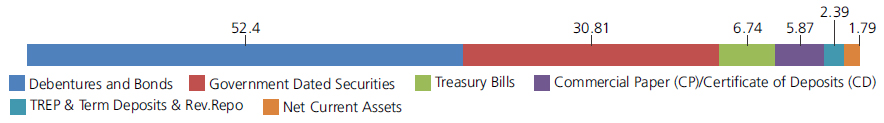
| Debentures and Bonds | ||
| Government Dated Securities | ||
| 5.74% Central Government | SOV | 6.64 |
| 5.53% Central Government(^) | SOV | 6.58 |
| 6.42% Central Government(^) | SOV | 4.28 |
| 4.93% Central Government(^) | SOV | 3.23 |
| 8.05% Karnataka State Govt-Karnataka | SOV | 2.43 |
| 4.41% Central Government | SOV | 2.33 |
| 8.27% Tamil Nadu State Govt-Tamil Nadu | SOV | 0.82 |
| 7.38% Central Government | SOV | 0.80 |
| 7.59% Central Government | SOV | 0.68 |
| 8.25% Maharashtra State Govt-Maharashtra | SOV | 0.61 |
| 8.08% Haryana State Govt-Haryana | SOV | 0.57 |
| 6.90% Central Government | SOV | 0.43 |
| 6.69% Madhya Pradesh State Govt-Madhya Pradesh | SOV | 0.39 |
| 6.97% Karnataka State Govt-Karnataka | SOV | 0.19 |
| 8.27% Rajasthan State Govt-Rajasthan | SOV | 0.16 |
| GS CG 22 Aug 2025 - (STRIPS) | SOV | 0.13 |
| GS CG 22 Aug 2026 - (STRIPS) | SOV | 0.12 |
| 1.44% Central Government | SOV | 0.11 |
| GS CG 22 Feb 2028 - (STRIPS) | SOV | 0.11 |
| GS CG 22 Feb 2029 - (STRIPS) | SOV | 0.10 |
| 8.45% Bihar State Govt-Bihar | SOV | 0.08 |
| 6.53% Tamil Nadu State Govt-Tamil Nadu | SOV | 0.01 |
| 5.28% Bihar State Govt-Bihar | SOV | 0.01 |
| Government Dated Securities - Total | 30.81 | |
| Public Sector Undertakings | ||
| Power Finance Corporation Ltd. | CRISIL AAA | 2.33 |
| National Bank for Agriculture & Rural Development | ICRA AAA | 2.23 |
| National Bank for Agriculture & Rural Development | CRISIL AAA | 2.14 |
| Rural Electrification Corporation Ltd. (^) | CRISIL AAA | 1.94 |
| Small Industries Development Bank Of India | ICRA AAA | 1.58 |
| State Bank Of India.(Basel III TIER II Bonds) | CRISIL AAA | 0.88 |
| Bank Of Baroda(Basel III TIER II Bonds) | FITCH IND AAA | 0.81 |
| Canara Bank(Basel III TIER II Bonds) | FITCH IND AAA | 0.78 |
| Export-Import Bank of India | CRISIL AAA | 0.77 |
| National Bank for Agriculture & Rural Development | ICRA AAA | 0.58 |
| Rural Electrification Corporation Ltd. | CRISIL AAA | 0.41 |
| ONGC Petro Additions Ltd. | ICRA AAA(CE) | 0.22 |
| Power Finance Corporation Ltd. | CRISIL AAA | 0.07 |
| National Thermal Power Corporation Ltd. | CRISIL AAA | 0.04 |
| Public Sector Undertakings - Total | 14.78 | |
| Corporate Debt/Financial Institutions | ||
| Bajaj Finance Ltd. | CRISIL AAA | 5.00 |
| HDFC Ltd.(^) | CRISIL AAA | 4.53 |
| LIC Housing Finance Ltd. | CRISIL AAA | 3.98 |
| Jamnagar Utilities & Power Private Limited ( Mukesh Ambani Group ) | CRISIL AAA | 3.02 |
| Sikka Ports & Terminals Ltd. ( Mukesh Ambani Group ) | CRISIL AAA | 2.31 |
| Nabha Power Ltd. ( backed by unconditional and irrevocable guarantee by Larsen & Toubro Ltd ) | ICRA AAA(CE) | 1.95 |
| Mahindra & Mahindra Financial Services Ltd. | FITCH AAA(IND) | 1.58 |
| Kotak Mahindra Prime Ltd. | CRISIL AAA | 1.55 |
| Bajaj Housing Finance Ltd. | CRISIL AAA | 1.36 |
| First Business Receivables Trust ( Originator Reliance Industries Ltd ) | CRISIL AAA(SO) | 1.31 |
| Grasim Industries Ltd. | CRISIL AAA | 1.26 |
| LIC Housing Finance Ltd. | CRISIL AAA | 1.19 |
| AXIS Finance Ltd. | CRISIL AAA | 0.94 |
| Hindustan Zinc Ltd. | CRISIL AAA | 0.93 |
| PTC First Business Receivables Trust (Series 23) 01/10/2025(First Business Receivables Trust) | CRISIL AAA(SO) | 0.85 |
| HDB Financial Services Ltd. | CRISIL AAA | 0.79 |
| Aditya Birla Housing Finance | ICRA AAA | 0.79 |
| India Grid Trust | CRISIL AAA | 0.77 |
| HDB Financial Services Ltd. | CRISIL AAA | 0.77 |
| Tata Capital Financial Services Limited | ICRA AAA | 0.59 |
| John Deere Financial India Private Limited | CRISIL AAA | 0.57 |
| Tata Capital Financial Services Limited | ICRA AAA | 0.39 |
| HDB Financial Services Ltd. | CARE AAA | 0.39 |
| Kotak Mahindra Prime Ltd. | CRISIL AAA | 0.28 |
| Jamnagar Utilities & Power Private Limited ( Mukesh Ambani Group) | CRISIL AAA | 0.20 |
| ICICI Home Finance Company Limited | CRISIL AAA | 0.19 |
| Tata Capital Housing Finance Ltd. | CRISIL AAA | 0.13 |
| Corporate Debt/Financial Institutions - Total | 37.62 | |
| Money Market Instruments | ||
| Commercial Paper(CP)/Certificate of Deposits(CD) | ||
| Treasury Bills | ||
| 182 Days Treasury Bill 22/12/2022 | SOV | 4.84 |
| 182 Days Treasury Bill 01/12/2022 | SOV | 0.78 |
| 182 Days Treasury Bill 15/12/2022 | SOV | 0.70 |
| 182 Days Treasury Bill 15/09/2022 | SOV | 0.42 |
| Treasury Bills - Total | 6.74 | |
| Public Sector Undertakings | ||
| Bank Of Baroda | FITCH A1+(IND) | 0.77 |
| Public Sector Undertakings - Total | 0.77 | |
| Corporate Debt/Financial Institutions | ||
| HDFC Bank Ltd. | CARE A1+ | 2.60 |
| Panatone Finvest Ltd. | CRISIL A1+ | 1.54 |
| AXIS Bank Ltd. | CRISIL A1+ | 0.76 |
| Standard Chartered Capital Ltd. | CRISIL A1+ | 0.20 |
| Corporate Debt/Financial Institutions - Total | 5.10 | |
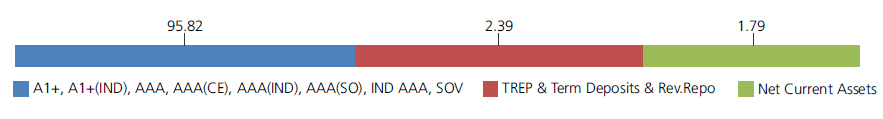
| Triparty Repo | 2.39 | |
| Net Current Assets/(Liabilities) | 1.79 | |
| Grand Total | 100.00 | |
| Monthly SIP of (₹) 10000 | Since Inception | 10 years | 7 years | 5 years | 3 years | 1 year |
| Total amount invested (₹) | 24,40,000 | 12,00,000 | 8,40,000 | 6,00,000 | 3,60,000 | 1,20,000 |
| Total Value as on August 30, 2022 (₹) | 55,31,615 | 16,99,157 | 10,45,397 | 6,93,166 | 3,83,666 | 1,21,611 |
| Scheme Returns (%) | 7.43 | 6.77 | 6.16 | 5.72 | 4.19 | 2.51 |
| Nifty Short Duration Index B-II Returns (%) | 7.75 | 7.22 | 6.68 | 6.34 | 5.29 | 3.89 |
| Alpha | -0.32 | -0.45 | -0.52 | -0.62 | -1.10 | -1.37 |
| Nifty Short Duration Index B-II (₹)# | 57,43,369 | 17,39,942 | 10,64,945 | 7,03,995 | 3,90,021 | 1,22,486 |
| Nifty Short Duration Index Returns (%) | 7.69 | 7.18 | 6.61 | 6.21 | 4.90 | 3.35 |
| Alpha | -0.26 | -0.41 | -0.45 | -0.49 | -0.71 | -0.84 |
| Nifty Short Duration Index (₹)# | 57,05,245 | 17,35,823 | 10,62,205 | 7,01,740 | 3,87,781 | 1,22,146 |
| CRISIL 10 Year Gilt Index (₹)^ | 47,16,749 | 16,18,565 | 10,01,014 | 6,71,445 | 3,71,125 | 1,20,983 |
| CRISIL 10 Year Gilt Index (%) | 6.06 | 5.84 | 4.94 | 4.45 | 1.99 | 1.53 |
Scheme Inception : - May 02,2002. The returns are calculated by XIRR approach assuming investment of ₹10,000/- on the 1st working day of every month. XIRR helps in calculating return on investments given an initial and
final value and a series of cash inflows and outflows and taking the time of investment into consideration. Since inception returns are assumed to be starting from the beginning of the subsequent month from the date of inception. # Benchmark ; ^ Additional Benchmark.
Alpha is difference of scheme return with benchmark return
Alpha is difference of scheme return with benchmark return
NAV
| Growth Option | Rs42.8651 |
| Direct Growth Option | Rs46.1519 |
| Reg-Plan-IDCW | Rs10.1501 |
| Dir-Plan-IDCW | Rs13.0588 |
Available Plans/Options
A) Regular Plan B) Direct Plan
Options: Payout of IDCW, Reinvestment of
IDCW & Growth (applicable for all plans)
| Fund Manager | Mr. Deepak Agrawal &
Mr. Vihag Mishra* (Dedicated fund manager for investments in foreign securities) |
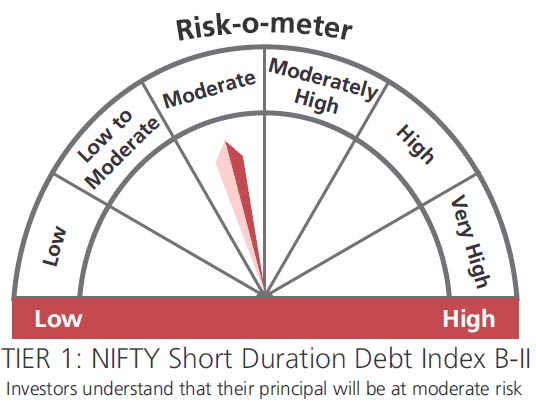
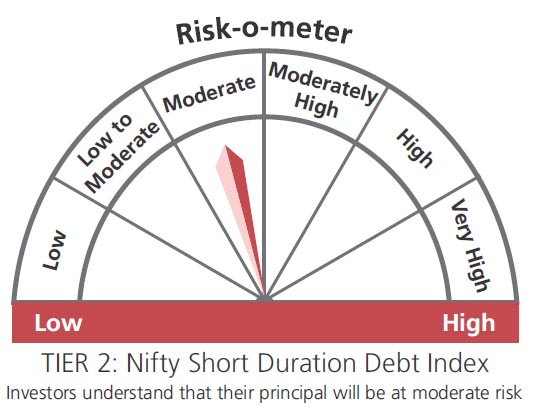
| Benchmark*** | Nifty Short Duration
Debt Index B-II (Tier 1) Nifty Short Duration Debt Index (Tier 2) |
| Allotment date | May 2, 2002 |
| AAUM | Rs12,730.57 crs |
| AUM | Rs 12,682.98 crs |
| Folio count | 26,519 |
IDCW Frequency
At discretion of trustees
Ratios
| Portfolio Average Maturity | 3.15 yrs |
| IRS Average Maturity* | 0.11 yrs |
| Net Average Maturity | 3.26 yrs |
| Portfolio Modified Duration | 1.36 yrs |
| IRS Modified Duration* | 0.10 yrs |
| Net Modified Duration | 1.46 yrs |
| Portfolio Macaulay Duration | 1.43 yrs |
| IRS Macaulay Duration* | 0.11 yrs |
| Net Macaulay Duration | 1.54 yrs |
| YTM | 7.00% |
| $Standard Deviation | 1.23% |
Minimum Investment Amount
Initial Investment:(i) Reinvestment of IDCW
& Growth - Rs5000 & above (ii)
Payout of
IDCW (Monthly IDCW) -
Rs50,000 & above
Additional Investment: Rs1000 & in multiples
of Rs1
Ideal Investment Horizon: 1 years & above
Load Structure
Entry Load: Nil. (applicable for all plans)
Exit Load: Nil.
Total Expense Ratio**
Regular: 1.16%; Direct: 0.35%
Data as on August 31, 2022
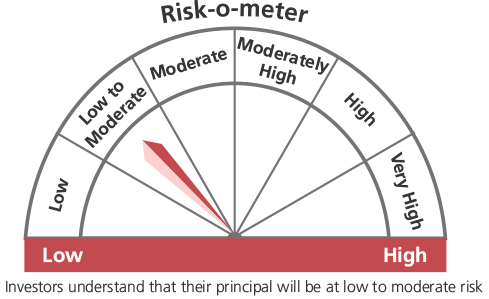
Fund
Benchmark
Benchmark
This product is suitable for investors who are seeking*:
- Income over a medium term investment horizon
- Investment in debt & money market securities with portfolio Macaulay duration between 1 year & 3 years
* Investors should consult their financial advisers if in doubt about whether the product is suitable for them.
(^) Fully or Party blocked against Interest Rate Swap (IRS) Hedging Position through Interest Rate Swaps as on 31 Aug 2022 is 7.38% of the net assets.
***As per SEBI circular no. SEBI/HO/IMD/IMD-11 DF3/P/CIR/2021 /652 dated October 27, 2021; AMFI letter no. 35P/MEM-COR/70/2021-22 dated November 25, 2021 and AMFI letter no. 35P/ MEM-COR/ 131 / 2021-22 dated March 31, 2022 with effect from April 01, 2022 ("Effective date"), the first tier benchmark index of the scheme. Existing benchmark will be Second Tier benchmark for aforementioned scheme.
**Total Expense Ratio includes applicable B30 fee and GST
* For Fund Manager experience, please refer 'Our Fund Managers'
For last three IDCW, please refer 'Dividend History'.
For scheme performance, please refer 'Scheme Performances'