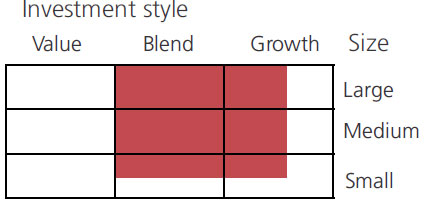
Large & mid cap fund - An open-ended equity scheme investing in both large cap and mid cap stocks
Large & mid cap fund - An open-ended equity scheme investing in both large cap and mid cap stocks
 |
 |
 
|
|
|
|
| Issuer/Instrument | Industry/ Rating |
% to Net Assets |
|---|---|---|
| Equity & Equity related |
||
| Banks | 17.66 | |
| ICICI Bank Ltd. | 5.69 | |
| State Bank Of India | 5.14 | |
| Axis Bank Ltd. | 3.33 | |
| HDFC Bank Ltd. | 2.06 | |
| AU Small Finance Bank Ltd. | 1.32 | |
| Bank Of Baroda | 0.12 | |
| Industrial Products | 6.99 | |
| Cummins India Ltd. | 2.31 | |
| Bharat Forge Ltd. | 2.20 | |
| AIA Engineering Limited. | 1.11 | |
| Polycab India Ltd. | 0.69 | |
| Supreme Industries Limited | 0.68 | |
| Chemicals & Petrochemicals | 6.36 | |
| SRF Ltd. | 3.52 | |
| Linde India Ltd. | 2.58 | |
| Aether Industries Ltd. | 0.26 | |
| IT - Software | 5.22 | |
| Infosys Ltd. | 3.17 | |
| Tata Consultancy Services Ltd. | 2.05 | |
| Pharmaceuticals & Biotechnology | 4.54 | |
| Sun Pharmaceuticals Industries Ltd. | 1.87 | |
| Cipla Ltd. | 1.44 | |
| Ipca Laboratories Ltd. | 0.75 | |
| Gland Pharma Limited | 0.48 | |
| Construction | 4.41 | |
| Larsen And Toubro Ltd. | 3.37 | |
| Kalpataru Power Transmission Ltd. | 0.60 | |
| Techno Electric & Engineering Company Limited | 0.44 | |
| Petroleum Products | 4.14 | |
| Reliance Industries Ltd. | 4.14 | |
| Electrical Equipment | 4.10 | |
| ABB India Ltd | 2.21 | |
| Thermax Ltd. | 1.89 | |
| Cement & Cement Products | 3.94 | |
| Ultratech Cement Ltd. | 1.60 | |
| JK Cement Ltd. | 1.41 | |
| The Ramco Cements Ltd | 0.73 | |
| Dalmia Bharat Limited | 0.20 | |
| Finance | 3.79 | |
| Bajaj Finance Ltd. | 2.80 | |
| CRISIL Ltd. | 0.65 | |
| Cholamandalam Financial Holdings Ltd. | 0.34 | |
| Auto Components | 3.33 | |
| Schaeffler India Ltd | 1.96 | |
| Balkrishna Industries Ltd. | 1.37 | |
| Gas | 3.08 | |
| Gujarat State Petronet Ltd. | 1.52 | |
| Indraprastha Gas Ltd. | 0.85 | |
| Petronet LNG Ltd. | 0.71 | |
| Automobiles | 2.82 | |
| Maruti Suzuki India Limited | 2.30 | |
| Hero MotoCorp Ltd. | 0.52 | |
| Diversified FMCG | 2.81 | |
| ITC Ltd. | 2.81 | |
| Aerospace & Defense | 2.69 | |
| Bharat Electronics Ltd. | 2.69 | |
| Consumer Durables | 2.46 | |
| Blue Star Ltd. | 1.17 | |
| Bata India Ltd. | 0.76 | |
| V-Guard Industries Ltd. | 0.53 | |
| Fertilizers & Agrochemicals | 2.38 | |
| Coromandel International Ltd. | 2.38 | |
| Ferrous Metals | 2.08 | |
| Jindal Steel & Power Ltd. | 2.08 | |
| Telecom - Services | 1.69 | |
| Bharti Airtel Ltd | 1.64 | |
| Bharti Airtel Ltd - Partly Paid Shares | 0.05 | |
| Realty | 1.44 | |
| Oberoi Realty Ltd | 1.44 | |
| Beverages | 1.42 | |
| United Spirits Ltd. | 1.42 | |
| Textiles & Apparels | 1.18 | |
| Page Industries Ltd | 1.18 | |
| Agricultural, Commercial & Construction Vehicles | 1.08 | |
| Ashok Leyland Ltd. | 0.57 | |
| BEML Ltd. | 0.51 | |
| Insurance | 1.03 | |
| Max Financial Services Ltd. | 1.03 | |
| Retailing | 0.93 | |
| Vedant Fashions Ltd | 0.93 | |
| Industrial Manufacturing | 0.90 | |
| Honeywell Automation India Ltd. | 0.90 | |
| Non - Ferrous Metals | 0.85 | |
| Hindalco Industries Ltd | 0.85 | |
| Leisure Services | 0.80 | |
| Jubilant Foodworks Limited | 0.80 | |
| Transport Services | 0.77 | |
| Container Corporation of India Ltd. | 0.77 | |
| Healthcare Services | 0.36 | |
| DR.Lal Pathlabs Ltd. | 0.36 | |
| Equity & Equity related - Total | 95.25 | |
| Mutual Fund Units | ||
| Kotak Liquid Scheme Direct Plan Growth | Mutual Fund | 0.10 |
| Mutual Fund Units - Total | 0.10 | |
| Futures | ||
| DR.Lal Pathlabs Ltd.-SEP2022 | 0.67 | |
| Triparty Repo | 4.59 | |
| Net Current Assets/(Liabilities) | 0.06 | |
| Grand Total | 100.00 | |
| | ||
Equity Derivative Exposuer is 0.67%
Note: Large Cap, Midcap, Small cap and Debt and Money Market stocks as a % age of Net Assets: 53.06, 37.49, 5.37 & 4.08.
| Monthly SIP of (₹) 10000 | Since Inception | 10 years | 7 years | 5 years | 3 years | 1 year |
| Total amount invested (₹) | 21,60,000 | 12,00,000 | 8,40,000 | 6,00,000 | 3,60,000 | 1,20,000 |
| Total Value as on August 30, 2022 (₹) | 99,97,125 | 27,60,824 | 14,83,508 | 9,30,107 | 5,02,807 | 1,27,821 |
| Scheme Returns (%) | 15.16 | 15.91 | 15.97 | 17.59 | 23.00 | 12.37 |
| Nifty Large Midcap 250 (TRI) Returns (%) | NA | 16.75 | 17.18 | 18.96 | 26.46 | 12.23 |
| Alpha | NA | -0.84 | -1.21 | -1.37 | -3.45 | 0.14 |
| Nifty Large Midcap 250 (TRI) (₹)# | NA | 28,88,611 | 15,48,835 | 9,61,684 | 5,27,059 | 1,27,732 |
| Nifty 200 (TRI) Returns (%) | 13.37 | 14.68 | 15.61 | 16.92 | 22.73 | 10.46 |
| Alpha | 1.79 | 1.23 | 0.36 | 0.67 | 0.28 | 1.91 |
| Nifty 200 (TRI) (₹)# | 82,43,169 | 25,84,257 | 14,64,336 | 9,14,907 | 5,00,908 | 1,26,631 |
| Nifty 50 (TRI) (₹)^ | 80,56,303 | 25,14,310 | 14,52,921 | 9,04,435 | 4,89,948 | 1,25,552 |
| Nifty 50 (TRI) Returns (%) | 13.16 | 14.16 | 15.39 | 16.45 | 21.13 | 8.74 |
Alpha is difference of scheme return with benchmark return. *All payouts during the period have been reinvested in the units of the scheme at the then prevailing NAV. Returns >= 1 year: CAGR (Compounded Annualised Growth Rate). N.A stands for data not available. Note: Point to Point (PTP) Returns in INR shows the value of 10,000/- investment made at inception. Source: ICRA MFI Explorer.
| Reg-Plan-IDCW | Rs35.7480 |
| Dir-Plan-IDCW | Rs40.1830 |
| Growth option | Rs204.9030 |
| Direct Growth option | Rs227.7180 |
A) Regular Plan B) Direct Plan
Options: Payout of IDCW, Reinvestment of
IDCW & Growth (applicable for all plans)
| Fund Manager | Mr. Harsha Upadhyaya & Mr. Arjun Khanna* (Dedicated fund manager for investments in foreign securities) |
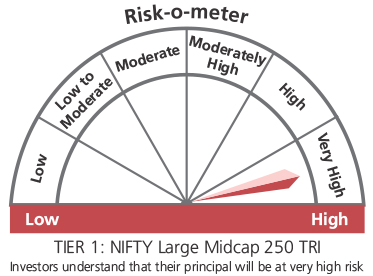
| Benchmark*** | NIFTY Large Midcap 250 TRI (Tier 1) Nifty 200 TRI (Tier 2) |
| Allotment date | September 9, 2004 |
| AAUM | Rs10,572.67 crs |
| AUM | Rs 10,842.43 crs |
| Folio count | 3,44,713 |
Trustee's Discretion
| Portfolio Turnover | 10.78% |
| $Beta | 0.89 |
| $Sharpe ## | 0.79 |
| $Standard Deviation | 21.11% |
| (P/E) | 25.28 |
| P/BV | 3.82 |
| IDCW Yield | 0.88 |
Initial Investment:
Rs5000 and in multiple of
Rs1 for purchase and for Rs0.01 for switches
Additional Investment: Rs1000 & in
multiples of Rs1
Ideal Investments Horizon: 5 years & above
Entry Load: Nil. (applicable for all plans)
Exit Load:
a) For redemption / switch out of upto 10%
of the initial investment amount (limit)
purchased or switched in within 1 year from
the date of allotment: Nil.
b) If units redeemed or switched out are in
excess of the limit within 1 year from the
date of allotment: 1%
c) If units are redeemed or switched out on
or after 1 year from the date of allotment:
NIL
Regular: 1.81%; Direct: 0.59%
Benchmark
Benchmark
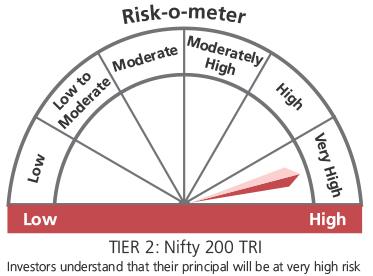
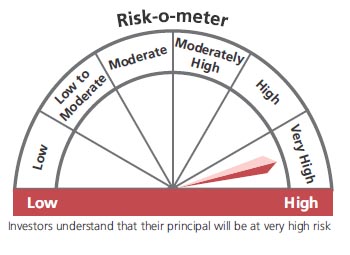
This product is suitable for investors who are seeking*:
- Long term capital growth
- Investment in portfolio of predominantly equity & equity related securities of large & midcap companies.
* Investors should consult their financial advisers if in doubt about whether the product is suitable for them.
***As per SEBI Circular dated 27th October 2021 The first tier benchmark is reflective of the category of the scheme and the second tier benchmark is demonstrative of the investment style / strategy of the Fund Manager within the category.
## Risk rate assumed to be 5.34% (FBIL Overnight MIBOR rate as on 30th August 2022).**Total Expense Ratio includes applicable B30 fee and GST.
* For Fund Manager experience, please refer 'Our Fund Managers'
For last three IDCW, please refer 'Dividend History'.
For scheme performance, please refer 'Scheme Performances'