An open-ended hybrid scheme investing predominantly in debt instruments
An open-ended hybrid scheme investing predominantly in debt instruments
 |
 |
 
|
|
|
|

| Issuer/Instrument | Industry/ Rating |
% to Net Assets |
|
|---|---|---|---|
| Equity & Equity related |
|||
| Banks | 5.78 | ||
| ICICI Bank Ltd. | 1.86 | ||
| State Bank Of India | 1.54 | ||
| HDFC Bank Ltd. | 1.28 | ||
| Kotak Mahindra Bank Ltd. | 0.64 | ||
| Axis Bank Ltd. | 0.46 | ||
| Consumer Non Durables | 2.87 | ||
| ITC Ltd. | 1.28 | ||
| Emami Ltd. | 0.78 | ||
| United Spirits Ltd. | 0.41 | ||
| United Breweries Ltd. | 0.31 | ||
| Prataap Snacks Ltd | 0.09 | ||
| Consumer Durables | 2.26 | ||
| Pokarna Ltd. | 0.85 | ||
| Greenply Industries Ltd. | 0.59 | ||
| Century Plyboards (India) Ltd. | 0.52 | ||
| Bata India Ltd. | 0.30 | ||
| Software | 2.04 | ||
| Persistent Systems Limited | 1.02 | ||
| Firstsource Solutions Ltd. | 0.42 | ||
| Infosys Ltd. | 0.31 | ||
| Tata Consultancy Services Ltd. | 0.29 | ||
| Petroleum Products | 1.95 | ||
| Reliance Industries Ltd. | 1.60 | ||
| Bharat Petroleum Corporation Ltd. | 0.19 | ||
| Hindustan Petroleum Corporation Ltd | 0.16 | ||
| Leisure Services | 1.69 | ||
| Sapphire Foods India Ltd. | 1.29 | ||
| Barbeque Nation Hospitality Ltd. | 0.40 | ||
| Auto | 1.58 | ||
| Maruti Suzuki India Limited | 1.28 | ||
| Mahindra & Mahindra Ltd. | 0.19 | ||
| Tata Motors Ltd. | 0.11 | ||
| Cement & Cement Products | 1.03 | ||
| The Ramco Cements Ltd | 0.44 | ||
| Ambuja Cements Ltd. | 0.30 | ||
| Ultratech Cement Ltd. | 0.18 | ||
| JK Cement Ltd. | 0.11 | ||
| Telecom - Services | 1.00 | ||
| Bharti Airtel Ltd | 0.96 | ||
| Bharti Airtel Ltd - Partly Paid Shares | 0.04 | ||
| Pharmaceuticals | 0.91 | ||
| Ami Organics Ltd | 0.21 | ||
| Gland Pharma Limited | 0.21 | ||
| Solara Active Pharma Sciences Ltd. | 0.21 | ||
| Eris Lifesciences Ltd. | 0.20 | ||
| Cadila Healthcare Ltd | 0.08 | ||
| Construction | 0.61 | ||
| KNR Constructions Ltd. | 0.22 | ||
| PNC Infratech Ltd | 0.22 | ||
| Mahindra Lifespace Developers Ltd | 0.17 | ||
| Auto Ancillaries | 0.60 | ||
| Subros Ltd. | 0.45 | ||
| Varroc Engineering Ltd. | 0.15 | ||
| Power | 0.60 | ||
| National Thermal Power Corporation Limited | 0.60 | ||
| Entertainment | 0.44 | ||
| Zee Entertainment Enterprises Ltd | 0.44 | ||
| Finance | 0.26 | ||
| Shriram City Union Finance Ltd. | 0.21 | ||
| Mahindra & Mahindra Financial Services Ltd. | 0.05 | ||
| Industrial Products | 0.24 | ||
| Ksb Ltd | 0.24 | ||
| Retailing | 0.23 | ||
| Zomato Ltd. | 0.17 | ||
| Medplus Health Services Ltd. | 0.06 | ||
| Aerospace & Defense | 0.21 | ||
| Bharat Electronics Ltd. | 0.17 | ||
| Data Patterns (India) Ltd. | 0.04 | ||
| Insurance | 0.20 | ||
| HDFC Life Insurance Company Ltd. | 0.20 | ||
| Ferrous Metals | 0.12 | ||
| Jindal Steel & Power Ltd. | 0.12 | ||
| Construction Project | 0.09 | ||
| Larsen And Toubro Ltd. | 0.09 | ||
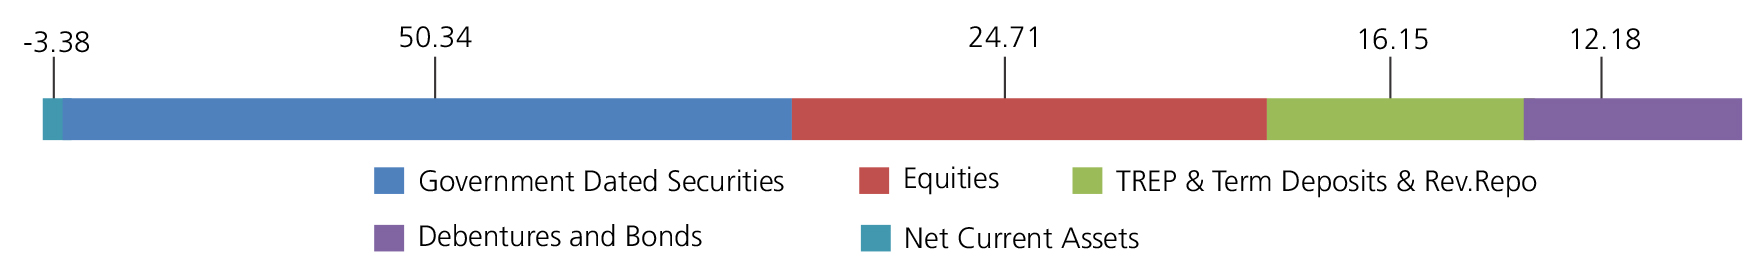
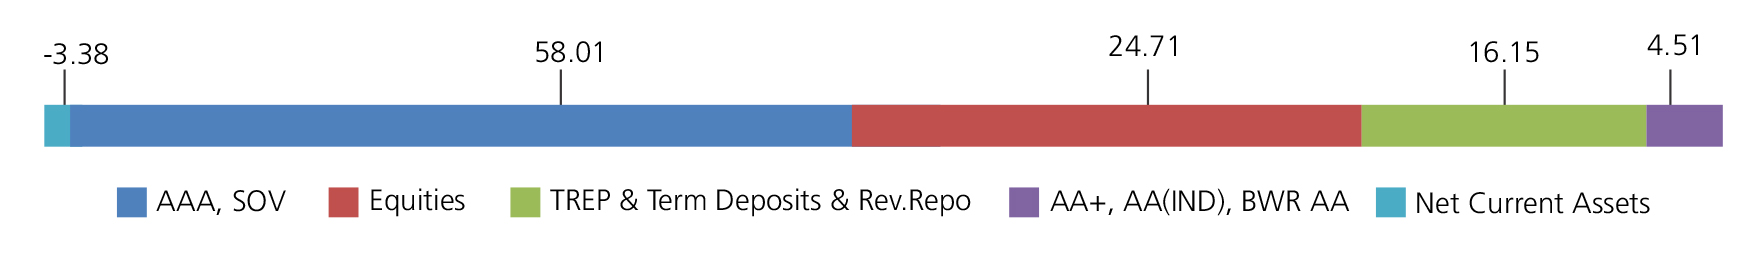
| Equity & Equity Related - Total | 24.71 | ||
| Debt Instruments | |||
| Debentures and Bonds | |||
| Government Dated Securities | |||
| 4.62% Central Government(^) | SOV | 20.00 | |
| 6.67% Central Government | SOV | 5.93 | |
| 6.64% Central Government | SOV | 5.39 | |
| 4.04% Central Government | SOV | 4.60 | |
| 4.81% Central Government | SOV | 3.54 | |
| 6.10% Central Government | SOV | 3.08 | |
| 6.82% State Government-Maharashtra | SOV | 1.62 | |
| GS CG 22 Aug 2028 - (STRIPS) | SOV | 1.27 | |
| 6.72% State Government-Kerala | SOV | 1.00 | |
| 6.75% State Government-Bihar | SOV | 0.80 | |
| GS CG 17 Jun 2027 - (STRIPS) | SOV | 0.49 | |
| 8.27% State Government-Rajasthan | SOV | 0.41 | |
| 8.42% State Government-Tamil Nadu | SOV | 0.29 | |
| GS CG 22 Aug 2029 - (STRIPS) | SOV | 0.23 | |
| GS CG 22 Feb 2030 - (STRIPS) | SOV | 0.22 | |
| GS CG 22 Aug 2030 - (STRIPS) | SOV | 0.21 | |
| GS CG 22 Aug 2022 - (STRIPS) | SOV | 0.13 | |
| GS CG 22 Feb 2022 - (STRIPS) | SOV | 0.13 | |
| GS CG 22 Aug 2026 - (STRIPS) | SOV | 0.10 | |
| GS CG 22 Feb 2027 - (STRIPS) | SOV | 0.10 | |
| GS CG 22 Aug 2027 - (STRIPS) | SOV | 0.09 | |
| GS CG 22 Aug 2036 - (STRIPS) | SOV | 0.09 | |
| GS CG 22 Feb 2028 - (STRIPS) | SOV | 0.09 | |
| GS CG 22 Feb 2036 - (STRIPS) | SOV | 0.09 | |
| GS CG 22 Feb 2029 - (STRIPS) | SOV | 0.08 | |
| GS CG 22 Aug 2031 - (STRIPS) | SOV | 0.07 | |
| GS CG 22 Aug 2032 - (STRIPS) | SOV | 0.07 | |
| GS CG 22 Feb 2032 - (STRIPS) | SOV | 0.07 | |
| GS CG 23/12/2025 - (STRIPS) | SOV | 0.06 | |
| GS CG 22 Aug 2043 - (STRIPS) | SOV | 0.03 | |
| GS CG 22 Feb 2043 - (STRIPS) | SOV | 0.03 | |
| GS CG 22 Feb 2044 - (STRIPS) | SOV | 0.03 | |
| Government Dated Securities - Total | 50.34 | ||
| Public Sector Undertakings | |||
| THDC India Ltd. (THDCIL) | FITCH AA(IND) | 2.80 | |
| Power Finance Corporation Ltd. | CRISIL AAA | 2.00 | |
| Bank Of Baroda (Basel III TIER I Bonds) | CRISIL AA+ | 1.58 | |
| Power Finance Corporation Ltd. | CRISIL AAA | 0.53 | |
| Indian Railway Finance Corporation Ltd. | CRISIL AAA | 0.35 | |
| Punjab National Bank(Basel III TIER I Bonds) | BRICKWORK BWR AA | 0.07 | |
| NHPC Ltd. | ICRA AAA | 0.06 | |
| Rural Electrification Corporation Ltd. | CRISIL AAA | 0.05 | |
| Public Sector Undertakings - Total | 7.44 | ||
| Corporate Debt/Financial Institutions | |||
| HDFC Bank Ltd. | CRISIL AAA | 2.71 | |
| Embassy Office Parks Reit | CRISIL AAA | 1.97 | |
| Hindalco Industries Ltd. | CRISIL AA+ | 0.06 | |
| Corporate Debt/Financial Institutions - Total | 4.74 | ||
| Triparty Repo | 16.15 | ||
| Net Current Assets/(Liabilities) | -3.38 | ||
| Grand Total | 100.00 | ||
| | |||
| Monthly SIP of (Rs) 10000 | Since Inception | 10 years | 7 years | 5 years | 3 years | 1 year |
| Total amount invested (Rs) | 21,70,000 | 12,00,000 | 8,40,000 | 6,00,000 | 3,60,000 | 1,20,000 |
| Total Value as on Dec 31, 2021 (Rs) | 52,60,333 | 20,53,695 | 12,18,725 | 7,98,048 | 4,44,839 | 1,27,892 |
| Scheme Returns (%) | 9.03 | 10.36 | 10.45 | 11.35 | 14.23 | 12.41 |
| CRISIL Hybrid 85+15 - Conservative Index Returns (%) | 9.06 | 9.74 | 9.55 | 9.76 | 10.32 | 7.38 |
| Alpha | -0.03 | 0.62 | 0.90 | 1.59 | 3.91 | 5.03 |
| CRISIL Hybrid 85+15 - Conservative Index (Rs)# | 52,78,868 | 19,87,161 | 11,80,199 | 7,67,132 | 4,20,313 | 1,24,727 |
| CRISIL 10 Year Gilt Index (Rs)^ | 40,75,472 | 17,02,245 | 10,50,545 | 6,96,828 | 3,87,125 | 1,21,012 |
| CRISIL 10 Year Gilt Index Returns (%) | 6.54 | 6.80 | 6.29 | 5.92 | 4.77 | 1.57 |
Alpha is difference of scheme return with benchmark return.
*All payouts during the period have been reinvested in the units of the scheme at the then prevailing NAV. Returns >= 1 year: CAGR (Compounded Annualised Growth Rate). N.A stands for data not available. Note: Point to Point (PTP) Returns in INR shows the value of 10,000/- investment made at inception. Source: ICRA MFI Explorer.
| Growth option | Rs42.8181 |
| Direct Growth option | Rs47.2281 |
| Monthly-Reg-Plan-IDCW | Rs13.0160 |
| Monthly-Dir-Plan-IDCW | Rs13.8198 |
| Quarterly-Reg-Plan-IDCW | Rs15.1778 |
| Quarterly-Dir-Plan-IDCW | Rs16.2318 |
A) Regular Plan B) Direct Plan
Options: Payout of IDCW, Reinvestment of
IDCW & Growth (applicable for all plans)
| Fund Manager | Mr. Devender Singhal & Mr. Abhishek Bisen* |
| Benchmark | CRISIL Hybrid 85+15 - Conservative Index |
| Allotment date | December 02, 2003 |
| AAUM | Rs1,237.09 crs |
| AUM | Rs1,267.99 crs |
| Folio count | 20,126 |
Monthly (12th of every Month)
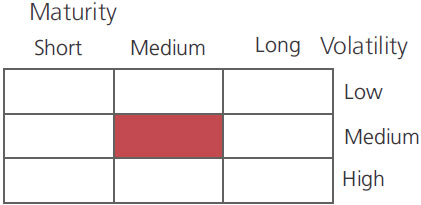
| Portfolio Average Maturity | 8.26 yrs |
| IRS Average Maturity* | 0.20 yrs |
| Net Average Maturity | 8.46 yrs |
| Portfolio Modified Duration | 2.94 yrs |
| IRS Modified Duration* | 0.19 yrs |
| Net Modified Duration | 3.13 yrs |
| Portfolio Macaulay Duration | 3.06 yrs |
| IRS Macaulay Duration* | 0.19 yrs |
| Net Macaulay Duration | 3.25 yrs |
| YTM | 5.61% |
| $Standard Deviation | 3.01% |
Source: $ICRAMFI Explorer.
Standard Deviation is calculated on Annualised basis using 3 years history of monthly returns.
Initial Investment:
(i) Reinvestment of IDCW & Growth and Payout of IDCW (Quarterly) - Rs5000 & above
(ii) Payout of IDCW (Monthly) - Rs50,000 & above
Additional Investment: Rs1000 & in multiples of Rs1
Ideal Investments Horizon - 3 year & above
Entry Load: Nil. (applicable for all plans)
Exit Load: a) For redemption / switch out of upto 8%
of the initial investment amount (limit)
purchased or switched in within 1 year from
the date of allotment: Nil.
b) If units redeemed or switched out are in
excess of the limit within 1 year from the
date of allotment: 1%.
c) If units are redeemed or switched out on
or after 1 year from the date of allotment:
Nil.
Regular: 1.89%; Direct:0.48%
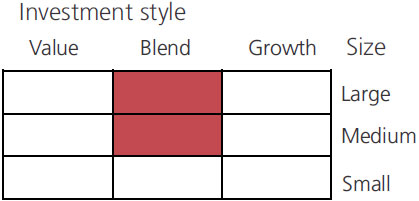
Fund
Benchmark
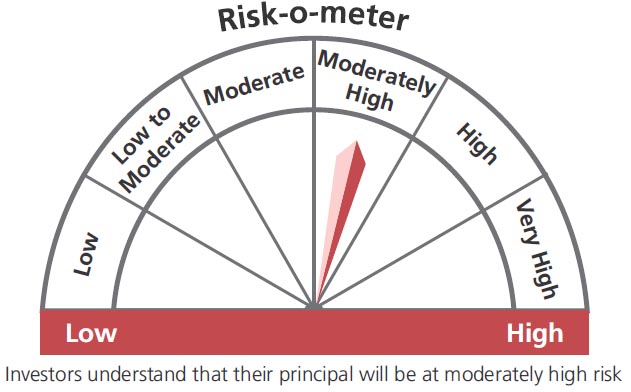
This product is suitable for investors who are seeking*:
- Income & capital growth over a long term horizon
- Investment in a portfolio of debt instruments with a moderate exposure in equity & equity related instruments
* Investors should consult their financial advisers if in doubt about whether the product is suitable for them.
##Risk rate assumed to be 3.60% (FBIL Overnight MIBOR rate as on 31st December 2021).**Total Expense Ratio includes applicable B30 fee and GST.
* For Fund Manager experience, please refer 'Our Fund Managers'
For last three IDCW, please refer 'Dividend History'.
For scheme performance, please refer 'Scheme Performances'