Small cap fund - An open-ended equity scheme predominantly investing in small cap stocks
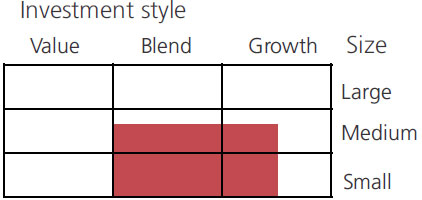
Small cap fund - An open-ended equity scheme predominantly investing in small cap stocks
 |
 |
 
|
|
|
|
| Issuer/Instrument | Industry/ Rating |
% to Net Assets |
|---|---|---|
| Equity & Equity related |
||
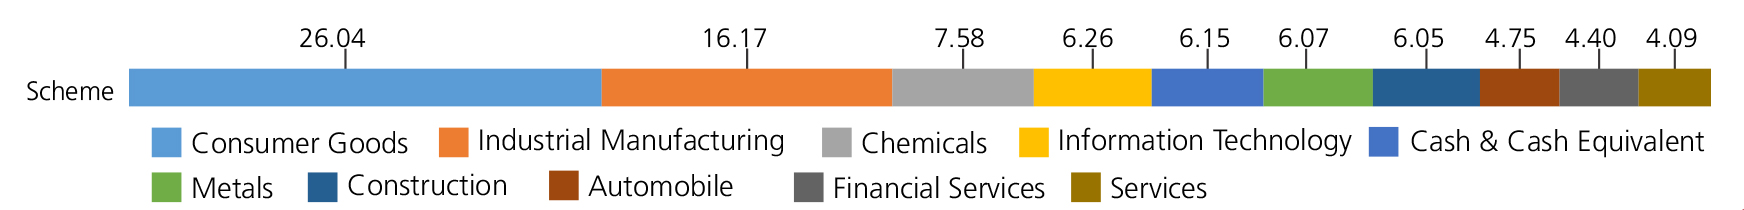
| Consumer Durables | 27.61 | |
| Century Plyboards (India) Ltd. | 5.57 | |
| Sheela Foam Ltd | 4.63 | |
| Somany Ceramics Ltd. | 3.13 | |
| Blue Star Ltd. | 2.96 | |
| Amber Enterprises India Ltd. | 2.71 | |
| V-Guard Industries Ltd. | 2.24 | |
| Orient Electric Ltd. | 2.17 | |
| Dixon Technologies India Ltd. | 1.46 | |
| VIP Industries Ltd. | 1.44 | |
| Kajaria Ceramics Ltd. | 1.30 | |
| Industrial Products | 13.25 | |
| Carborundum Universal Ltd. | 4.46 | |
| Supreme Industries Limited | 3.16 | |
| Nilkamal Ltd | 1.94 | |
| Schaeffler India Ltd | 1.74 | |
| Apollo Pipes Ltd. | 1.16 | |
| WPIL Ltd | 0.45 | |
| Finolex Cables Ltd. | 0.34 | |
| Chemicals | 7.57 | |
| Galaxy Surfactants Ltd. | 3.12 | |
| Solar Industries India Limited | 1.95 | |
| Laxmi Organic Industries Limited | 1.45 | |
| Atul Ltd. | 0.84 | |
| Clean Science and Technology Ltd | 0.14 | |
| Alkyl Amines Chemicals Ltd. | 0.07 | |
| Software | 6.27 | |
| Persistent Systems Limited | 3.44 | |
| Cyient Ltd. | 2.41 | |
| Happiest Minds Technologies Limited | 0.42 | |
| Ferrous Metals | 6.07 | |
| Ratnamani Metals & Tubes Ltd. | 2.60 | |
| Shyam Metalics and Energy Ltd | 2.00 | |
| APL Apollo Tubes Ltd. | 1.47 | |
| Auto Ancillaries | 3.40 | |
| Rolex Rings Ltd. | 1.21 | |
| Sandhar Technologies Ltd. | 0.72 | |
| Motherson Sumi Systems Ltd. | 0.58 | |
| Sansera Engineering Ltd. | 0.56 | |
| Varroc Engineering Ltd. | 0.33 | |
| Textile Products | 2.64 | |
| Lux Industries Limited | 2.34 | |
| Kewal Kiran Clothing Limited. | 0.30 | |
| Cement & Cement Products | 2.60 | |
| JK Cement Ltd. | 1.81 | |
| The Ramco Cements Ltd | 0.79 | |
| Banks | 2.49 | |
| ICICI Bank Ltd. | 1.71 | |
| AU Small Finance Bank Ltd. | 0.78 | |
| Transportation | 2.48 | |
| Blue Dart Express Ltd. | 1.84 | |
| Great Eastern Shipping Company Ltd | 0.64 | |
| Industrial Capital Goods | 2.46 | |
| BEML Ltd. | 1.37 | |
| Thermax Ltd. | 1.09 | |
| Retailing | 2.24 | |
| V-Mart Retail Ltd. | 0.76 | |
| Shoppers Stop Ltd. | 0.64 | |
| Medplus Health Services Ltd. | 0.54 | |
| Go Fashion (India) Ltd. | 0.30 | |
| Construction | 1.77 | |
| Mahindra Lifespace Developers Ltd | 0.95 | |
| JMC Projects (India) Ltd. | 0.69 | |
| G R Infraprojects Limited | 0.13 | |
| Pesticides | 1.71 | |
| Dhanuka Agritech Ltd. | 0.88 | |
| P I Industries Ltd | 0.83 | |
| Household Appliances | 1.61 | |
| Hawkins Cooker Ltd | 1.61 | |
| Consumer Non Durables | 1.57 | |
| Prataap Snacks Ltd | 1.10 | |
| Heritage Foods Ltd | 0.47 | |
| Finance | 1.54 | |
| Shriram City Union Finance Ltd. | 0.75 | |
| Aavas Financiers Ltd. | 0.48 | |
| Mahindra & Mahindra Financial Services Ltd. | 0.26 | |
| Anand Rathi Wealth Ltd. | 0.05 | |
| Auto | 1.34 | |
| V.S.T Tillers Tractors Ltd | 1.34 | |
| Construction Project | 1.15 | |
| Techno Electric & Engineering Company Limited | 1.15 | |
| Pharmaceuticals | 0.93 | |
| Torrent Pharmaceuticals Ltd. | 0.55 | |
| Cadila Healthcare Ltd | 0.38 | |
| Textiles - Synthetic | 0.78 | |
| Garware Technical Fibres Ltd. | 0.78 | |
| Fertilisers | 0.73 | |
| Coromandel International Ltd. | 0.73 | |
| Oil | 0.53 | |
| Hindustan Oil Exploration Company Ltd. | 0.53 | |
| Aerospace & Defense | 0.46 | |
| MTAR Technologies Ltd. | 0.46 | |
| Capital Markets | 0.35 | |
| UTI Asset Management Company Ltd | 0.35 | |
| Leisure Services | 0.26 | |
| Barbeque Nation Hospitality Ltd. | 0.26 | |
| Equity & Equity Related - Total | 93.81 | |
| Triparty Repo | 6.41 | |
| Net Current Assets/(Liabilities) | -0.22 | |
| Grand Total | 100.00 | |
Note: Large Cap, Midcap, Small cap and Debt and Money Market stocks as a % age of Net Assets: 3.22%, 24.04%, 66.55% & 6.19.
| Monthly SIP of (₹) 10000 | Since Inception | 10 years | 7 years | 5 years | 3 years | 1 year |
| Total amount invested (Rs) | 20,30,000 | 12,00,000 | 8,40,000 | 6,00,000 | 3,60,000 | 1,20,000 |
| Total Value as on Dec 31, 2021(Rs) | 12,024,418 | 41,72,645 | 20,25,443 | 12,83,220 | 7,32,668 | 1,52,406 |
| Scheme Returns (%) | 18.62 | 23.55 | 24.72 | 30.97 | 52.05 | 53.58 |
| NIFTY Smallcap 250 (TRI) Returns (%) | NA | 18.58 | 18.93 | 23.84 | 44.69 | 51.29 |
| Alpha* | NA | 4.97 | 5.79 | 7.13 | 7.36 | 2.29 |
| NIFTY Smallcap 250 (TRI) (Rs)# | NA | 31,89,777 | 16,49,187 | 10,82,853 | 6,69,087 | 1,51,095 |
| Nifty Smallcap 100 (TRI) Returns (%) | 13.10 | 16.44 | 17.39 | 22.01 | 42.79 | 48.05 |
| Alpha* | 5.52 | 7.10 | 7.33 | 8.95 | 9.26 | 5.54 |
| Nifty Smallcap 100 (TRI) Returns(Rs)# | 68,85,726 | 28,43,114 | 15,61,180 | 10,36,309 | 6,53,272 | 1,49,232 |
| Nifty 50 (TRI) (Rs)^ | 71,17,409 | 26,51,932 | 14,98,966 | 9,53,162 | 5,18,733 | 1,33,842 |
| Nifty 50 (TRI) Returns (%) | 13.43 | 15.15 | 16.25 | 18.57 | 25.22 | 22.06 |
TRI – Total Return Index, In terms of SEBI circular dated January 4, 2018, the performance of the scheme is benchmarked to the Total Return variant (TRI) of the Benchmark Index instead of Price Return Variant (PRI).
*All payouts during the period have been reinvested in the units of the scheme at the then prevailing NAV. Returns >= 1 year: CAGR (Compounded Annualised Growth Rate). N.A stands for data not available. Note: Point to Point (PTP) Returns in INR shows the value of 10,000/- investment made at inception. Source: ICRA MFI Explorer.
*Alpha is difference of scheme return with benchmark return.
| Reg-Plan-IDCW | Rs73.0830 |
| Dir-Plan-IDCW | Rs82.6030 |
| Growth option | Rs167.5180 |
| Direct Growth option | Rs188.0630 |
A) Regular Plan B) Direct Plan
Options: Payout of IDCW, Reinvestment of
IDCW & Growth (applicable for all plans)
| Fund Manager | Mr. Pankaj Tibrewal* |
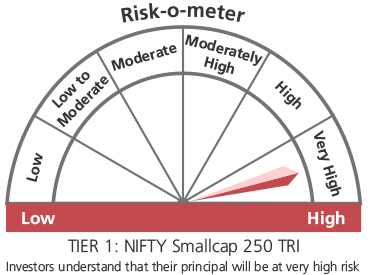
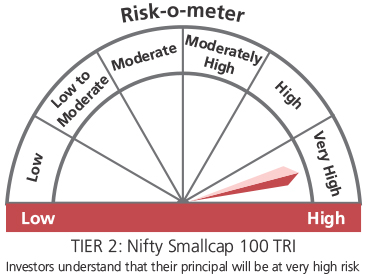
| Benchmark*** | NIFTY Smallcap 250
TRI (Tier 1) NIFTY Smallcap 100 TRI (Tier 2) |
| Allotment date | February 24, 2005 |
| AAUM | Rs6,600.90 crs |
| AUM | Rs6,761.51 crs |
| Folio count | 3,92,534 |
Trustee's Discretion
| Portfolio Turnover | 11.65% |
| $Beta | 0.89 |
| $Sharpe ## | 1.10 |
| $Standard Deviation | 27.43% |
| (P/E) | 40.79 |
| P/BV | 4.07 |
| IDCW Yield | 0.7 |
Initial Investment: Rs5000 and in multiple of
Rs1 for purchase and for Rs0.01 for switches
Additional Investment: Rs1000 & in
multiples of Rs1
Ideal Investments Horizon: 5 years & above
Entry Load: Nil. (applicable for all plans)
Exit Load:
a) For redemption / switch out of upto 10%
of the initial investment amount (limit)
purchased or switched in within 1 year from
the date of allotment: Nil.
b) If units redeemed or switched out are in
excess of the limit within 1 year from the date
of allotment: 1%
c) If units are redeemed or switched out on or
after 1 year from the date of allotment: NIL
Regular: 1.94%; Direct: 0.49%
Benchmark
Benchmark
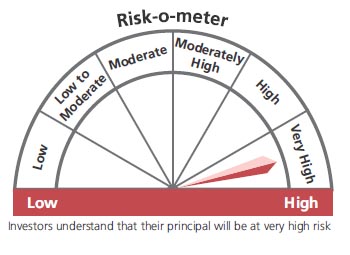
This product is suitable for investors who are seeking*:
- Long term capital growth
- Investment in equity & equity related securities predominantly in small cap Stocks.
* Investors should consult their financial advisers if in doubt about whether the product is suitable for them.
***As per SEBI Circular dated 27th October 2021 The first tier benchmark is reflective of the category of the scheme and the second tier benchmark is demonstrative of the investment style / strategy of the Fund Manager within the category.
## Risk rate assumed to be 3.60% (FBIL Overnight MIBOR rate as on 31st December 2021).**Total Expense Ratio includes applicable B30 fee and GST.
* For Fund Manager experience, please refer 'Our Fund Managers'
For last three IDCW, please refer 'Dividend History'.
For scheme performance, please refer 'Scheme Performances'