 
|
|
|
Key Events for the Month of December 2025
• India’s Services Purchasing Managers’ Index (PMI) rose to 59.8 in November from 58.9 in October, signaling
a “historically sharp” expansion in output.
• India’s Manufacturing Purchasing Managers’ Index (PMI) fell to a nine-month low of 56.6 from 59.2 in
October, marking one of the steepest month-on-month declines.
• India’s Consumer Price Inflation (CPI) rose to 0.71% in November, up from 0.25% in October.
• India’s Wholesale Price Index (WPI) rose to -0.32% in November from -1.21% in October. The negative
inflation print was attributed to lower prices of food items, mineral oils, crude petroleum and natural gas, basic
metals, and electricity.
• India’s gross GST collections rose 6.1% year-on-year to ₹1.74 lakh crore, marking the fastest growth in three
months.
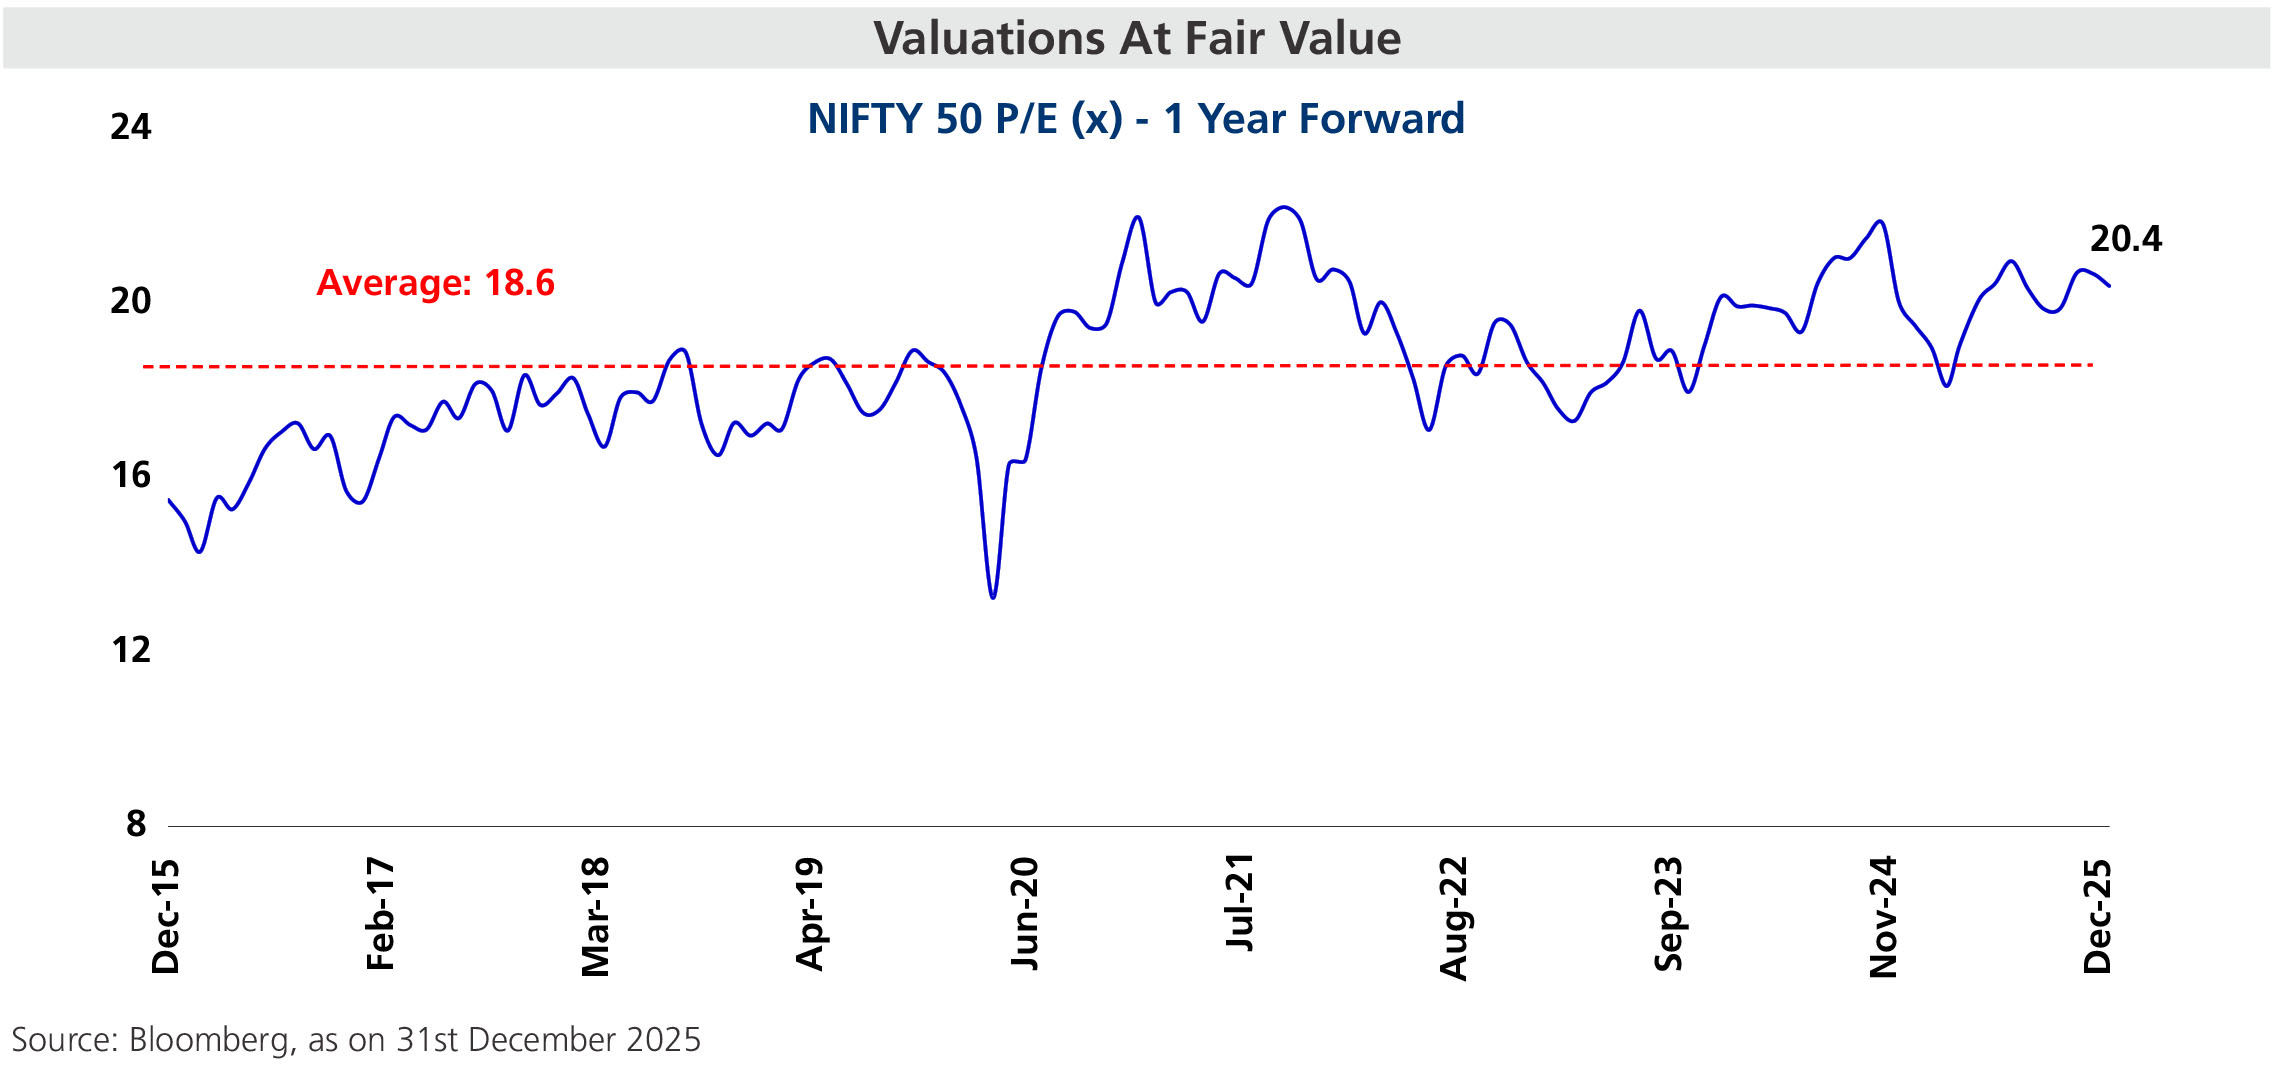
• Equity markets registered significant year-on-year gains in December 2025, with the Nifty 50 rising by 10.5%
and the BSE Sensex by 9.1%, supported by resilient corporate earnings, strong domestic investor inflows, sectoral
outperformance, and a supportive macro-policy environment despite global volatility.
| |
Sectoral Index Performance |
| Name | 3 Months | 6 Months | 1 Year | 3 Years | 5 Years |
| Nifty Auto Index | 6.2% | 18.1% | 23.5% | 30.7% | 25.1% |
| Nifty Bank Index | 9.1% | 4.0% | 17.1% | 11.5% | 13.8% |
| Nifty Energy Index | 0.9% | -3.4% | 0.4% | 10.9% | 15.8% |
| Nifty Financial Services Index | 6.1% | 1.6% | 17.4% | 13.3% | 12.7% |
| Nifty FMCG Index | 1.4% | 1.1% | -2.3% | 7.9% | 10.2% |
| Nifty Healthcare Index | 3.5% | 1.2% | -2.1% | 22.3% | 21.3% |
| Nifty Infrastructure Index | 6.8% | 2.2% | 13.6% | 22.3% | 21.4% |
| Nifty IT Index | 12.6% | -2.7% | -12.6% | 9.8% | 9.3% |
| Nifty Media Index | -6.4% | -17.7% | -20.5% | -10.1% | -2.6% |
| Nifty Metal Index | 11.3% | 17.1% | 29.1% | 18.4% | 27.9% |
| Nifty Pharma Index | 5.9% | 3.1% | -2.9% | 21.7% | 12.0% |
| Nifty PSU Bank Index | 13.4% | 18.5% | 30.5% | 25.4% | 37.2% |
| Nifty Realty Index | 1.2% | -11.0% | -16.6% | 26.6% | 22.8% |
| BSE Consumer Durables Index | 4.0% | 0.4% | -6.9% | 14.7% | 14.6% |
| BSE Industrial Index | 0.7% | -3.5% | -1.3% | 28.9% | 33.7% |
Past performance may or may not be sustained in the future.
| |
Global Index Performance |
| Name | 3 Months | 6 Months | 1 Year | 3 Years | 5 Years |
| MSCI World Index | 2.9% | 10.0% | 19.5% | 19.4% | 10.5% |
| MSCI Emerging Index | 4.3% | 14.9% | 30.6% | 13.6% | 1.7% |
| MSCI India index | 5.9% | 2.0% | 8.1% | 14.1% | 13.9% |
| Dow Jones Industrial Average Index | 3.6% | 9.0% | 13.0% | 13.2% | 9.4% |
| Nasdaq Composite Index | 2.6% | 14.1% | 20.4% | 30.4% | 12.5% |
| Nikkei 225 Index | 12.0% | 24.3% | 26.2% | 24.4% | 12.9% |
| Shanghai Composite Index | 12.0% | 24.3% | 26.2% | 24.4% | 12.9% |
| Deutsche Boerse AG german Stock Index DAX | 2.6% | 2.4% | 23.0% | 20.7% | 12.3% |
Past performance may or may not be sustained in the future.