Mid cap fund - An open-ended equity scheme predominantly investing in mid cap stocks
Mid cap fund - An open-ended equity scheme predominantly investing in mid cap stocks
 |
 |
 
|
|
|
|
| Issuer/Instrument | Industry/ Rating |
% to Net Assets |
|---|---|---|
| Equity & Equity related |
||
| Industrial Products | 16.62 | |
| Supreme Industries Limited | 4.61 | |
| Cummins India Ltd. | 3.81 | |
| SKF India Ltd | 3.07 | |
| Bharat Forge Ltd. | 2.04 | |
| Ratnamani Metals & Tubes Ltd. | 1.59 | |
| APL Apollo Tubes Ltd. | 1.50 | |
| Consumer Durables | 13.46 | |
| Kajaria Ceramics Ltd. | 2.48 | |
| Whirlpool of India Ltd. | 2.13 | |
| Sheela Foam Ltd | 1.61 | |
| Bata India Ltd. | 1.54 | |
| Voltas Ltd. | 1.13 | |
| Blue Star Ltd. | 1.02 | |
| V-Guard Industries Ltd. | 0.87 | |
| Dixon Technologies India Ltd. | 0.82 | |
| Amber Enterprises India Ltd. | 0.76 | |
| Metro Brands Ltd. | 0.67 | |
| Hawkins Cooker Ltd | 0.43 | |
| Auto Components | 8.66 | |
| Schaeffler India Ltd | 4.12 | |
| MRF Limited | 1.05 | |
| Balkrishna Industries Ltd. | 0.98 | |
| Exide Industries Ltd | 0.86 | |
| Samvardhana Motherson International Limited | 0.44 | |
| Amara Raja Batteries Ltd. | 0.42 | |
| ZF Commercial Vehicle Control Systems India Limited | 0.31 | |
| Sundaram Fasteners Ltd. | 0.25 | |
| Motherson Sumi Wiring India Limited | 0.23 | |
| Banks | 7.39 | |
| ICICI Bank Ltd. | 1.60 | |
| AU Small Finance Bank Ltd. | 1.58 | |
| Federal Bank Ltd. | 1.52 | |
| State Bank Of India | 1.21 | |
| Axis Bank Ltd. | 1.03 | |
| City Union Bank Ltd. | 0.45 | |
| Chemicals and Petrochemicals | 7.10 | |
| Solar Industries India Limited | 3.12 | |
| Atul Ltd. | 2.37 | |
| SRF Ltd. | 1.61 | |
| Pharmaceuticals and Biotechnology | 5.57 | |
| Ipca Laboratories Ltd. | 2.02 | |
| Torrent Pharmaceuticals Ltd. | 1.67 | |
| Zydus Lifesciences Limited | 0.87 | |
| Alkem Laboratories Ltd. | 0.40 | |
| GLAND PHARMA LIMITED | 0.35 | |
| Laurus Labs Ltd. | 0.26 | |
| Fertilizers and Agrochemicals | 5.16 | |
| P I Industries Ltd | 2.72 | |
| Coromandel International Ltd. | 2.44 | |
| Cement and Cement Products | 4.24 | |
| JK Cement Ltd. | 2.25 | |
| The Ramco Cements Ltd | 1.29 | |
| Shree Cement Ltd. | 0.57 | |
| Ambuja Cements Ltd. | 0.13 | |
| IT - Software | 3.68 | |
| Persistent Systems Limited | 3.68 | |
| Finance | 3.12 | |
| Sundaram Finance Ltd. | 1.55 | |
| Mahindra & Mahindra Financial Services Ltd. | 1.04 | |
| Shriram Finance Ltd. | 0.50 | |
| HDFC Ltd. | 0.03 | |
| Electrical Equipment | 2.76 | |
| Thermax Ltd. | 2.76 | |
| Realty | 2.42 | |
| Oberoi Realty Ltd | 2.42 | |
| Aerospace and Defense | 2.15 | |
| Bharat Electronics Ltd. | 2.15 | |
| Textiles and Apparels | 1.64 | |
| Page Industries Ltd | 0.95 | |
| Lux Industries Limited | 0.39 | |
| Kewal Kiran Clothing Limited. | 0.30 | |
| Ferrous Metals | 1.17 | |
| Jindal Steel & Power Ltd. | 1.17 | |
| Insurance | 1.17 | |
| Max Financial Services Ltd. | 1.04 | |
| Life Insurance Corporation Of India Ltd. | 0.13 | |
| Retailing | 1.05 | |
| Vedant Fashions Ltd | 0.98 | |
| FSN E-Commerce Ventures Ltd. | 0.07 | |
| Personal Products | 0.96 | |
| Emami Ltd. | 0.96 | |
| Healthcare Services | 0.84 | |
| Apollo Hospitals Enterprises Ltd. | 0.84 | |
| Gas | 0.80 | |
| Gujarat State Petronet Ltd. | 0.42 | |
| Gujarat Gas Ltd. | 0.38 | |
| Agricultural Food and other Product | 0.68 | |
| Tata Consumer Products Ltd | 0.68 | |
| Construction | 0.62 | |
| Kalpataru Power Transmission Ltd. | 0.39 | |
| PNC Infratech Ltd | 0.23 | |
| Petroleum Products | 0.59 | |
| Hindustan Petroleum Corporation Ltd | 0.59 | |
| Food Products | 0.32 | |
| Godrej Agrovet Ltd. | 0.32 | |
| Beverages | 0.17 | |
| United Spirits Ltd. | 0.17 | |
| Financial Technology (Fintech) | 0.11 | |
| PB Fintech Ltd. | 0.11 | |
| Equity & Equity related - Total | 92.45 | |
| Triparty Repo | 7.68 | |
| Net Current Assets/(Liabilities) | -0.13 | |
| Grand Total | 100.00 | |
Note: Large Cap, Midcap, Small cap and Debt and Money Market stocks as a % age of Net Assets: 16.00, 66.39, 10.06 & 7.55.
| Monthly SIP of (₹) 10000 | Since Inception | 10 years | 7 years | 5 years | 3 years | 1 year |
| Total amount invested (₹) | 19,20,000.00 | 12,00,000 | 8,40,000 | 6,00,000 | 3,60,000 | 1,20,000 |
| Total Value as on Feb 28, 2023 (₹) | 85,28,454.00 | 31,18,540 | 15,19,243 | 9,65,481 | 4,93,144 | 1,23,529 |
| Scheme Returns (%) | 16.77 | 18.18 | 16.65 | 19.13 | 21.62 | 5.54 |
| Nifty Midcap 150 (TRI) Returns (%) | 15.89 | 16.7 | 15.79 | 17.79 | 20.48 | 2.41 |
| Alpha | 0.88 | 1.48 | 0.86 | 1.34 | 1.14 | 3.13 |
| Nifty Midcap 150 (TRI) (₹)# | 78,45,951.00 | 28,80,375 | 14,73,323 | 9,34,373 | 4,85,432 | 1,21,543 |
| Nifty Midcap 100 (TRI) Returns (%) | 14.48 | 14.76 | 14.12 | 16.77 | 20.5 | 1.62 |
| Alpha | 2.29 | 3.41 | 2.52 | 2.37 | 1.12 | 3.92 |
| Nifty Midcap 100 (TRI) (₹)# | 68,70,693.00 | 25,95,935 | 13,88,536 | 9,11,356 | 4,85,565 | 1,21,037 |
| Nifty 50 (TRI) (₹)^ | 54,06,125.00 | 23,08,536 | 13,32,984 | 8,34,041 | 4,44,243 | 1,20,594 |
| Nifty 50 (TRI) Returns (%) | 11.90 | 12.57 | 12.98 | 13.16 | 14.19 | 0.93 |
Alpha is difference of scheme return with benchmark return. *All payouts during the period have been reinvested in the units of the scheme at the then prevailing NAV. Source: ICRA MFI Explorer.
| Reg-Plan-IDCW | Rs41.339 |
| Dir-Plan-IDCW | Rs50.574 |
| Growth option | Rs75.267 |
| Direct Growth option | Rs84.886 |
A) Regular Plan B) Direct Plan
Options: Payout of IDCW, Reinvestment of
IDCW & Growth (applicable for all plans)
| Fund Manager* | Mr. Pankaj Tibrewal & Mr. Arjun Khanna (Dedicated fund manager for investments in foreign securities) |
| Benchmark*** | NIFTY Midcap 150 TRI (Tier 1) Nifty Midcap 100 TRI (Tier 2) |
| Allotment date | March 30, 2007 |
| AAUM | Rs23,818.55 crs |
| AUM | Rs23,962.94 crs |
| Folio count | 11,18,070 |
Trustee's Discretion
| Portfolio Turnover | 2.92% |
| $Beta | 0.92 |
| $Sharpe ## | 0.69 |
| $Standard Deviation | 24.17% |
| (P/E) | 26.64 |
| P/BV | 4.16 |
| IDCW Yield | 0.81 |
Initial Investment: Rs100 and in multiple of
Rs1 for purchase and for Rs0.01 for switches
Additional Investment: Rs100 & in
multiples of Rs1
Ideal Investments Horizon: 5 years & above
Entry Load: Nil. (applicable for all plans)
Exit Load:
a) For redemption / switch out of upto 10%
of the initial investment amount (limit)
purchased or switched in within 1 year from
the date of allotment: Nil.
b) If units redeemed or switched out are in
excess of the limit within 1 year from the
date of allotment: 1%
c) If units are redeemed or switched out on
or after 1 year from the date of allotment:
NIL
Regular: 1.68%; Direct: 0.49%
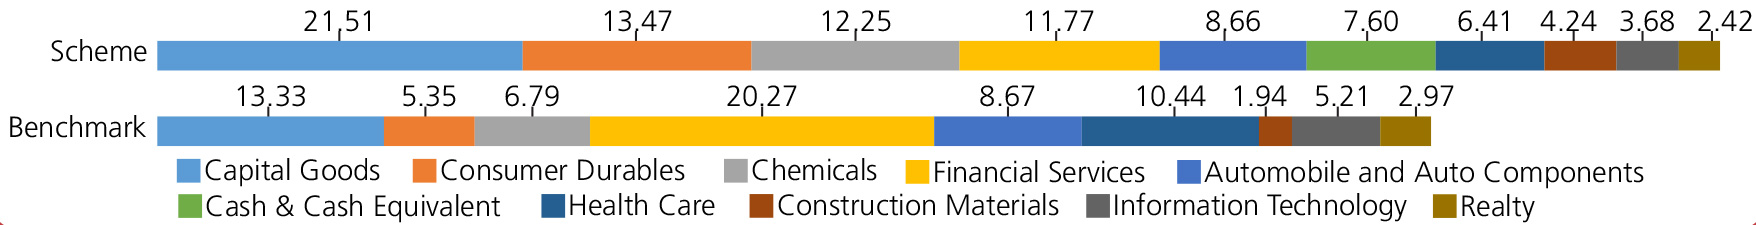
Benchmark
Benchmark

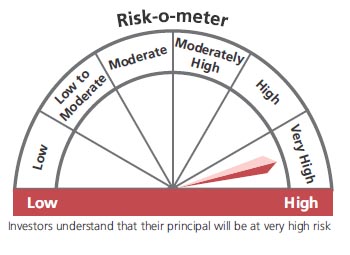
This product is suitable for investors who are seeking*:
- Long term capital growth
- Investment in equity & equity related securities predominantly in mid cap companies.
* Investors should consult their financial advisers if in doubt about whether the product is suitable for them.
The above risk-o—meter is based on the scheme portfolio as on 28th February, 2023. An addendum may be issued or updated on the website for new riskometer.
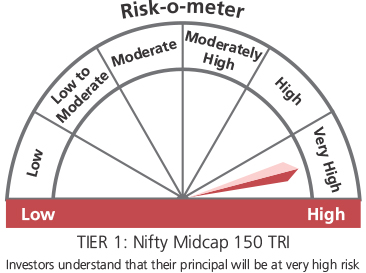
***As per SEBI Circular dated 27th October 2021 The first tier benchmark is reflective of the category of the scheme and the second tier benchmark is demonstrative of the investment style / strategy of the Fund Manager within the category.
## Risk rate assumed to be 6.70% (FBIL Overnight MIBOR rate as on 28th February 2023).**Total Expense Ratio includes applicable B30 fee and GST.
* For Fund Manager experience, please refer 'Our Fund Managers'
For last three IDCW, please refer 'Dividend History'.
For scheme performance, please refer 'Scheme Performances'