An open ended debt scheme investing in money market instruments
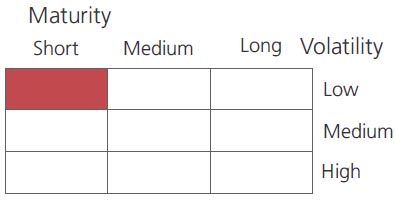
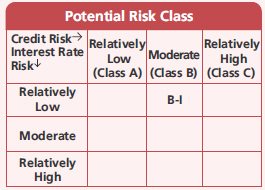
A relatively low interest rate risk and moderate credit risk
An open ended debt scheme investing in money market instruments
A relatively low interest rate risk and moderate credit risk
 |
 |
 
|
|
|
|
| Issuer/Instrument | Industry/ Rating |
% to Net Assets |
|---|---|---|
| Government Dated Securities | ||
| 7.16% Central Government | SOV | 0.35 |
| GS CG 15/06/2023 - (STRIPS) | SOV | 0.29 |
| GS CG 16/06/2023 - (STRIPS) | SOV | 0.25 |
| 8.39% Rajasthan State Govt-Rajasthan | SOV | 0.18 |
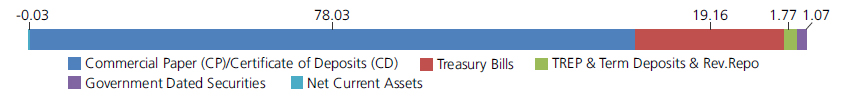
| Government Dated Securities - Total | 1.07 | |
| Money Market Instruments | ||
| Commercial Paper(CP)/Certificate of Deposits(CD) | ||
| Corporate Debt/Financial Institutions | ||
| AXIS Bank Ltd. | CRISIL A1+ | 9.11 |
| HDFC Ltd. | CRISIL A1+ | 5.08 |
| HDFC Bank Ltd. | CRISIL A1+ | 3.88 |
| HDFC Bank Ltd. | CARE A1+ | 3.59 |
| Federal Bank Ltd. | CRISIL A1+ | 2.97 |
| Piramal Enterprises Ltd. | CRISIL A1+ | 2.93 |
| L & T Finance Ltd. | CRISIL A1+ | 2.74 |
| Panatone Finvest Ltd. | ICRA A1+ | 2.12 |
| Vedanta Ltd. | CRISIL A1+ | 1.88 |
| IndusInd Bank Ltd. | CRISIL A1+ | 1.79 |
| Can Fin Homes Ltd. | ICRA A1+ | 1.71 |
| Hero FinCorp Ltd. | CRISIL A1+ | 1.62 |
| Tata Motors Finance Ltd. | ICRA A1+ | 1.54 |
| Panatone Finvest Ltd. | CRISIL A1+ | 1.35 |
| Motilal Oswal Financial Services Limited | ICRA A1+ | 1.04 |
| Tata Teleservices Limited | CRISIL A1+ | 0.75 |
| Bajaj Financial Securities Limited | CRISIL A1+ | 0.70 |
| Aditya Birla Finance Ltd. | ICRA A1+ | 0.69 |
| Barclays Investments & Loan (India) Ltd. | CRISIL A1+ | 0.69 |
| JM Financial Services Limited | CRISIL A1+ | 0.69 |
| Bahadur Chand Investments Private Limited | ICRA A1+ | 0.68 |
| Motilal Oswal Finvest Ltd. | CRISIL A1+ | 0.68 |
| JM Financial Products Limited | CRISIL A1+ | 0.66 |
| Muthoot Finance Ltd. | CRISIL A1+ | 0.65 |
| Pilani Investment and Industries Corporation Ltd | CRISIL A1+ | 0.65 |
| Godrej Industries Ltd | CRISIL A1+ | 0.42 |
| Nuvama Wealth and Investment Ltd | CRISIL A1+ | 0.35 |
| Network18 Media & Investments Ltd. | CARE A1+ | 0.13 |
| LIC Housing Finance Ltd. | CRISIL A1+ | 0.12 |
| TV18 Broadcast Ltd. | CARE A1+ | 0.03 |
| Corporate Debt/Financial Institutions - Total | 51.24 | |
| Public Sector Undertakings | ||
| Canara Bank | CRISIL A1+ | 7.44 |
| Small Industries Development Bank Of India | CARE A1+ | 4.84 |
| Bank Of Baroda | FITCH IND A1+ | 4.55 |
| National Bank for Agriculture & Rural Development | ICRA A1+ | 3.10 |
| Union Bank of India | FITCH IND A1+ | 2.62 |
| Indian Bank | CRISIL A1+ | 1.31 |
| Union Bank of India | ICRA A1+ | 1.14 |
| Punjab National Bank | CARE A1+ | 0.65 |
| Union Bank of India | FITCH A1+(IND) | 0.65 |
| Small Industries Development Bank Of India | CRISIL A1+ | 0.49 |
| Public Sector Undertakings - Total | 26.79 | |
| Treasury Bills | ||
| 182 Days Treasury Bill 09/03/2023 | SOV | 5.19 |
| 182 Days Treasury Bill 22/06/2023 | SOV | 4.47 |
| 182 Days Treasury Bill 01/06/2023 | SOV | 3.45 |
| 182 Days Treasury Bill 15/06/2023 | SOV | 2.41 |
| 182 Days Treasury Bill 16/03/2023 | SOV | 2.38 |
| 364 Days Treasury Bill 01/06/2023 | SOV | 0.72 |
| 364 Days Treasury Bill 15/06/2023 | SOV | 0.34 |
| 364 Days Treasury Bill 29/06/2023 | SOV | 0.17 |
| 182 Days Treasury Bill 08/06/2023 | SOV | 0.03 |
| Treasury Bills - Total | 19.16 | |
| Triparty Repo | 1.77 | |
| Net Current Assets/(Liabilities) | -0.03 | |
| Grand Total | 100.00 | |

| Monthly SIP of (₹) 10000 | Since Inception | 10 years | 7 years | 5 years | 3 years | 1 year |
| Total amount invested (₹) | 23,60,000 | 12,00,000 | 8,40,000 | 6,00,000 | 3,60,000 | 1,20,000 |
| Total Value as on Feb 28, 2023 (₹) | 49,85,198 | 16,56,164 | 10,28,046 | 6,84,664 | 3,86,711 | 1,23,697 |
| Scheme Returns (%) | 7.06 | 6.28 | 5.69 | 5.23 | 4.72 | 5.82 |
| Nifty Money Market Index B-I Returns (%) | 7.12 | 6.03 | 5.38 | 4.96 | 4.63 | 5.97 |
| Alpha | -0.06 | 0.25 | 0.31 | 0.27 | 0.09 | -0.15 |
| Nifty Money Market Index B-I (₹)# | 50,19,672 | 16,35,082 | 10,16,797 | 6,79,975 | 3,86,194 | 1,23,792 |
| Nifty Money Market Index Returns (%) | 7.11 | 6.07 | 5.44 | 5.02 | 4.68 | 5.94 |
| Alpha | -0.05 | 0.21 | 0.25 | 0.21 | 0.04 | -0.12 |
| Nifty Money Market Index (₹)# | 50,14,588 | 16,38,123 | 10,18,769 | 6,80,997 | 3,86,456 | 1,23,775 |
| CRISIL 1 Year T-Bill Index (₹)^ | 44,47,454 | 16,12,915 | 10,10,899 | 6,76,914 | 3,82,846 | 1,23,089 |
| CRISIL 1 Year T-Bill Index Returns (%) | 6.04 | 5.77 | 5.22 | 4.78 | 4.05 | 4.85 |
Alpha is difference of scheme return with benchmark return.
| Growth Option | Rs3774.358 |
| Direct Growth Option | Rs3798.93 |
| Monthly-Reg-Plan-IDCW | Rs1052.872 |
| Monthly-Dir-Plan-IDCW | Rs1084.946 |
A) Regular Plan B) Direct Plan
Options: Payout of IDCW (w.e.f May 15,
2017, Under Monthly IDCW option only),
Reinvestment of IDCW & Growth
(applicable for all plans)
| Fund Manager* | Mr. Deepak Agrawal,
Mr. Manu Sharma &
Mr. Vihag Mishra
(Dedicated fund manager for investments in foreign securities) |
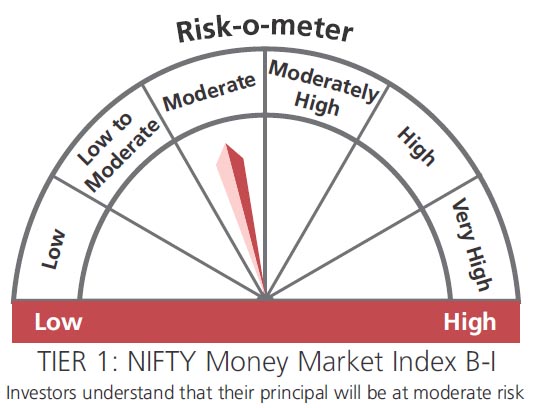
| Benchmark*** | Nifty Money Market Index B-I (Tier 1) Nifty Money Market Index (Tier 2) |
| Allotment date | July 14, 2003 |
| AAUM | Rs14,038.04 crs |
| AUM | Rs11,173.90 crs |
| Folio count | 13,424 |
Monthly (12th of every Month)
| Portfolio Average Maturity | 0.46 yrs |
| IRS Average Maturity* | - |
| Net Average Maturity | 0.46 yrs |
| Portfolio Modified Duration | 0.46 yrs |
| IRS Modified Duration* | - |
| Net Modified Duration | 0.46 yrs |
| Portfolio Macaulay Duration | 0.46 yrs |
| IRS Macaulay Duration* | - |
| Net Macaulay Duration | 0.46 yrs |
| Annualised YTM* | 7.68% |
| $Standard Deviation | 0.45% |
*in case of semi annual YTM, it will be annualized.
Initial Investment:Rs5000 Under growth,
weekly IDCW and monthly IDCW option & Rs1,00,000 under Daily Reinvestment of
IDCW option,
Additional Investment: Rs1000 & in multiples
of Rs1
Ideal Investment Horizon: 3-6 Months
Entry Load: Nil. (applicable for all plans)
Exit Load:
Nil. (applicable for all plans)
Regular: 0.36%; Direct: 0.26%
Fund
Benchmark
Benchmark
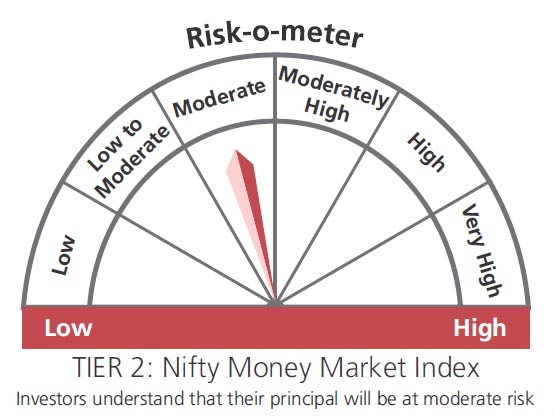
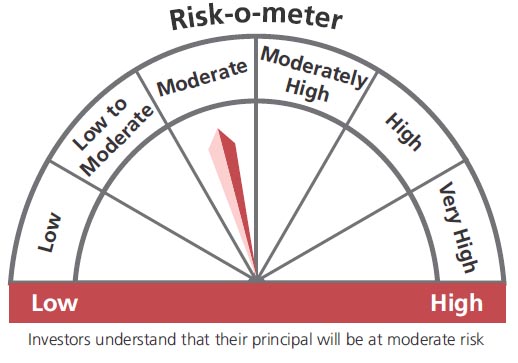
This product is suitable for investors who are seeking*:
- Income over a short term investment horizon
- Investment in money market securities
* Investors should consult their financial advisers if in doubt about whether the product is suitable for them.
The above risk-o—meter is based on the scheme portfolio as on 28th February, 2023. An addendum may be issued or updated on the website for new riskometer
**Total Expense Ratio includes applicable B30 fee and GST
***As per SEBI circular no. SEBI/HO/IMD/IMD-11 DF3/P/CIR/2021 /652 dated October 27, 2021; AMFI letter no. 35P/MEM-COR/70/2021-22 dated November 25, 2021 and AMFI letter no. 35P/ MEM-COR/ 131 / 2021-22 dated March 31, 2022 with effect from April 01, 2022 ("Effective date"), the first tier benchmark index of the scheme. Existing benchmark will be Second Tier benchmark for aforementioned scheme.
* For Fund Manager experience, please refer 'Our Fund Managers'
For last three IDCW, please refer 'Dividend History'.
For scheme performance, please refer 'Scheme Performances'