An open-ended hybrid scheme investing predominantly in equity and equity related instruments
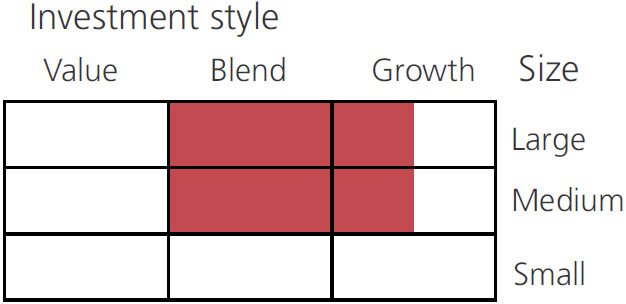
An open-ended hybrid scheme investing predominantly in equity and equity related instruments
 |
 |
 
|
|
|
|
| Issuer/Instrument | Industry/ Rating |
% to Net Assets |
|---|---|---|
| Equity & Equity related |
||
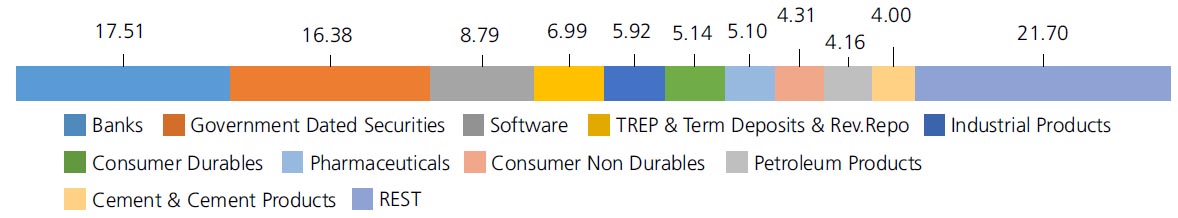
| Banks | 17.51 | |
| ICICI Bank Ltd. | 5.16 | |
| HDFC Bank Ltd. | 3.66 | |
| State Bank Of India | 3.54 | |
| Axis Bank Ltd. | 2.29 | |
| Kotak Mahindra Bank Ltd. | 2.27 | |
| AU Small Finance Bank Ltd. | 0.59 | |
| Software | 8.79 | |
| Infosys Ltd. | 4.44 | |
| Tata Consultancy Services Ltd. | 2.00 | |
| Tech Mahindra Ltd. | 1.57 | |
| Oracle Financial Services Software Ltd | 0.78 | |
| Industrial Products | 5.92 | |
| Schaeffler India Ltd | 1.68 | |
| Supreme Industries Limited | 1.56 | |
| Bharat Forge Ltd. | 1.26 | |
| Cummins India Ltd. | 0.99 | |
| Carborundum Universal Ltd. | 0.43 | |
| Consumer Durables | 5.14 | |
| Century Plyboards (India) Ltd. | 2.30 | |
| Sheela Foam Ltd | 1.72 | |
| Kajaria Ceramics Ltd. | 0.58 | |
| Whirlpool of India Ltd. | 0.54 | |
| Pharmaceuticals | 5.10 | |
| Sun Pharmaceuticals Industries Ltd. | 1.52 | |
| Dr Reddys Laboratories Ltd. | 1.13 | |
| Torrent Pharmaceuticals Ltd. | 0.97 | |
| Cipla Ltd. | 0.96 | |
| Cadila Healthcare Ltd | 0.52 | |
| Consumer Non Durables | 4.31 | |
| United Spirits Ltd. | 1.84 | |
| ITC Ltd. | 1.09 | |
| Emami Ltd. | 0.76 | |
| Hindustan Unilever Ltd. | 0.62 | |
| Petroleum Products | 4.16 | |
| Reliance Industries Ltd. | 2.68 | |
| Bharat Petroleum Corporation Ltd. | 0.80 | |
| Indian Oil Corporation Ltd | 0.68 | |
| Cement & Cement Products | 4.00 | |
| Shree Cement Ltd. | 1.53 | |
| JK Cement Ltd. | 1.50 | |
| The Ramco Cements Ltd | 0.97 | |
| Construction | 2.36 | |
| Mahindra Lifespace Developers Ltd | 1.29 | |
| Oberoi Realty Ltd | 0.70 | |
| JMC Projects (India) Ltd. | 0.37 | |
| Chemicals | 2.52 | |
| Solar Industries India Limited | 1.64 | |
| Galaxy Surfactants Ltd. | 0.88 | |
| Auto | 2.46 | |
| Maruti Suzuki India Limited | 1.15 | |
| Mahindra & Mahindra Ltd. | 0.72 | |
| V.S.T Tillers Tractors Ltd | 0.59 | |
| Construction Project | 2.42 | |
| Larsen And Toubro Ltd. | 1.61 | |
| Techno Electric & Engineering Company Limited | 0.81 | |
| Industrial Capital Goods | 2.12 | |
| Thermax Ltd. | 2.12 | |
| Finance | 1.42 | |
| HDFC Ltd. | 1.42 | |
| Gas | 1.25 | |
| Gujarat Gas Ltd. | 0.66 | |
| Petronet LNG Ltd. | 0.59 | |
| Insurance | 1.23 | |
| ICICI Lombard General Insurance Company Ltd | 0.94 | |
| HDFC Life Insurance Company Ltd. | 0.29 | |
| Auto Ancillaries | 1.11 | |
| Motherson Sumi Systems Ltd. | 0.78 | |
| Motherson Sumi Wiring India Limited | 0.25 | |
| Rolex Rings Ltd. | 0.08 | |
| Power | 0.91 | |
| National Thermal Power Corporation Limited | 0.91 | |
| Fertilisers | 0.77 | |
| Coromandel International Ltd. | 0.77 | |
| Non - Ferrous Metals | 0.60 | |
| Hindalco Industries Ltd | 0.60 | |
| Transportation | 0.58 | |
| Blue Dart Express Ltd. | 0.58 | |
| Pesticides | 0.53 | |
| P I Industries Ltd | 0.53 | |
| Ferrous Metals | 0.42 | |
| Shyam Metalics and Energy Ltd | 0.42 | |
| Equity & Equity related - Total | 75.63 | |
| Mutual Fund Units | ||
| Brookfield India Real Estate Trust | Construction | 0.28 |
| Mutual Fund Units - Total | 0.28 | |
| Debt Instruments | ||
| Debentures and Bonds | ||
| Corporate Debt/Financial Institutions | ||
| LIC Housing Finance Ltd. | CRISIL AAA | 0.02 |
| Corporate Debt/Financial Institutions - Total | 0.02 | |
| Government Dated Securities | ||
| 4.62% Central Government(^) | SOV | 5.20 |
| 6.64% Central Government | SOV | 2.24 |
| 6.1 % Central Government | SOV | 1.81 |
| 6.67% Central Government | SOV | 1.29 |
| 6.54% Central Government | SOV | 1.24 |
| 4.81% Central Government | SOV | 1.04 |
| 4.04% Central Government | SOV | 0.65 |
| 7.17% State Government-Gujarat | SOV | 0.65 |
| GS CG 22 Aug 2028 - (STRIPS) | SOV | 0.53 |
| 6.75% State Government-Bihar | SOV | 0.43 |
| 4.68% Central Government | SOV | 0.41 |
| GS CG 17 Jun 2027 - (STRIPS) | SOV | 0.21 |
| GS CG 22 Aug 2029 - (STRIPS) | SOV | 0.10 |
| GS CG 22 Feb 2030 - (STRIPS) | SOV | 0.10 |
| GS CG 22 Aug 2030 - (STRIPS) | SOV | 0.09 |
| GS CG 22 Aug 2022 - (STRIPS) | SOV | 0.04 |
| GS CG 22 Aug 2036 - (STRIPS) | SOV | 0.04 |
| GS CG 22 Feb 2036 - (STRIPS) | SOV | 0.04 |
| GS CG 22 Aug 2026 - (STRIPS) | SOV | 0.03 |
| GS CG 22 Aug 2027 - (STRIPS) | SOV | 0.03 |
| GS CG 22 Feb 2027 - (STRIPS) | SOV | 0.03 |
| GS CG 22 Feb 2028 - (STRIPS) | SOV | 0.03 |
| GS CG 22 Feb 2029 - (STRIPS) | SOV | 0.03 |
| GS CG 23/12/2025 - (STRIPS) | SOV | 0.03 |
| GS CG 22 Aug 2031 - (STRIPS) | SOV | 0.02 |
| GS CG 22 Aug 2032 - (STRIPS) | SOV | 0.02 |
| GS CG 22 Feb 2032 - (STRIPS) | SOV | 0.02 |
| GS CG 22 Aug 2043 - (STRIPS) | SOV | 0.01 |
| GS CG 22 Feb 2043 - (STRIPS) | SOV | 0.01 |
| GS CG 22 Feb 2044 - (STRIPS) | SOV | 0.01 |
| Government Dated Securities - Total | 16.38 | |
| Triparty Repo | 6.99 | |
| Net Current Assets/(Liabilities) | 0.70 | |
| Grand Total | 100 | |
| Grand Total | 100.00 | |
| | ||
Term Deposit as provided above is towards margin for derivatives transactions
| Monthly SIP of (₹) 10000 | Since Inception | 7 years | 5 years | 3 years | 1 year |
| Total amount invested (Rs) | 8,80,000 | 8,40,000 | 6,00,000 | 3,60,000 | 1,20,000 |
| Total Value as on Feb 28, 2022 (Rs) | 14,59,667 | 13,74,315 | 8,87,524 | 4,93,661 | 1,24,969 |
| Scheme Returns (%) | 13.53 | 13.83 | 15.69 | 21.69 | 7.85 |
| NIFTY 50 Hybrid Composite Debt 65:35 Index Returns (%) | 12.70 | 12.96 | 13.86 | 16.53 | 6.61 |
| Alpha | 0.83 | 0.88 | 1.83 | 5.15 | 1.24 |
| NIFTY 50 Hybrid Composite Debt 65:35 Index (Rs)# | 14,14,754 | 13,32,006 | 8,48,573 | 4,59,329 | 1,24,193 |
| Nifty 50 (TRI) (Rs)^ | 15,15,910 | 14,29,610 | 9,00,928 | 4,90,138 | 1,24,835 |
| Nifty 50 (TRI) Returns (%) | 14.54 | 14.94 | 16.30 | 21.17 | 7.63 |
Scheme Inception : - November 03, 2014. The returns are calculated by XIRR approach assuming investment of Rs10,000/- on the 1st working day of every month. XIRR helps in calculating return on investments given an initial and final value and a series of cash inflows and outflows and taking the time of investment into consideration. Since inception returns are assumed to be starting from the beginning of the subsequent month from the date of inception. # Benchmark ; ^ Additional Benchmark TRI - Total Return Index, In terms of SEBI circular dated January 4, 2018, the performance of the scheme is benchmarked to the Total Return variant (TRI) of the Benchmark Index instead of Price Return Variant (PRI).
Alpha is difference of scheme return with benchmark return.(^) Fully or Party blocked against Interest Rate Swap (IRS) Hedging Position through Interest Rate Swaps as on 28 Feb 2022 is 3.16% of the net assets.
| Reg-Plan-IDCW | Rs22.7540 |
| Dir-Plan-IDCW | Rs26.6190 |
| Growth Option | Rs38.7180 |
| Direct Growth Option | Rs43.4240 |
A) Regular Plan B) Direct Plan
Options: Payout of IDCW, Reinvestment of IDCW & Growth (applicable for all plans)
| Fund Manager | Mr. Pankaj Tibrewal & Mr. Abhishek Bisen* |
| Benchmark | NIFTY 50 Hybrid Composite Debt 65:35 Index |
| Allotment date | November 25, 1999 |
| AAUM | Rs2,387.83 crs |
| AUM | Rs2,375.34 crs |
| Folio count | 68,859 |
Half Yearly (25th of Mar/Sep)
| Portfolio Turnover | 7.27% |
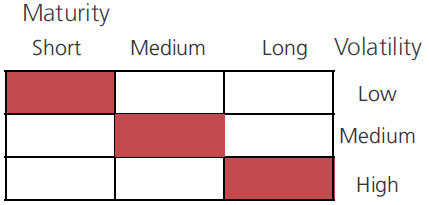
| Portfolio Average Maturity | 7.20% |
| IRS Average Maturity* | 0.65% |
| Net Average Maturity | 7.86% |
| Portfolio Modified Duration | 2.79% |
| IRS Modified Duration* | 0.56% |
| Net Modified Duration | 3.35% |
| Portfolio Macaulay Duration | 2.88% |
| IRS Macaulay Duration* | 0.58% |
| Net Macaulay Duration | 3.46% |
| YTM | 5.31% |
| $Beta | 1.23 |
| $Sharpe## | 0.87 |
| $Standard Deviation | 18.26 |
Initial Investment: Rs5000 and in multiple of
Rs1 for purchase and for Rs0.01 for switches
Additional Investment: Rs1000 & in
multiples of Rs1
Ideal Investments Horizon: 5 years & above
Entry Load: Nil. (applicable for all plans)
Exit Load:
a) For redemption/switch out of upto 8%
of the initial investment amount (limit)
purchased or switched in within 1 year from
the date of allotment: Nil.
b) If units redeemed or switched out are in
excess of the limit within 1 year from the
date of allotment: 1%.
c) If units are redeemed or switched out on
or after 1 year from the date of allotment:
NIL
Regular: 2.09%; Direct: 0.67%
Fund
Benchmark
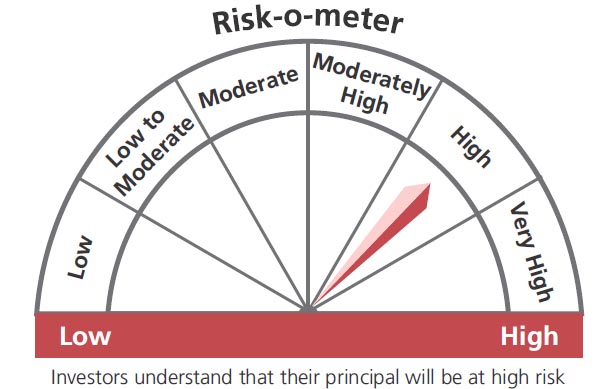
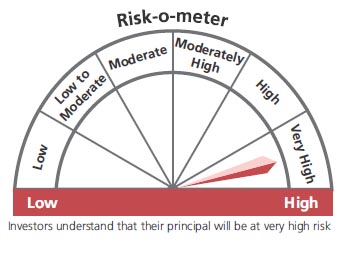
This product is suitable for investors who are seeking*:
- Long term capital growth
- Investment in equity & equity related securities balanced with income generation by investing in debt & money.
* Investors should consult their financial advisers if in doubt about whether the product is suitable for them.
## Risk rate assumed to be 3.43% (FBIL Overnight MIBOR rate as on 28th February 2022).**Total Expense Ratio includes applicable B30 fee and GST.
* For Fund Manager experience, please refer 'Our Fund Managers'
For last three IDCW, please refer 'Dividend History'.
For scheme performance, please refer 'Scheme Performances'