An open ended hybrid scheme investing predominantly in debt instruments
An open ended hybrid scheme investing predominantly in debt instruments
 |
 |
 
|
|
|
|
| Issuer/Instrument | Rating | % to Net Assets |
|---|---|---|
| Equity & Equity related | ||
| Banks | 4.48 | |
| HDFC Bank Ltd. | 1.16 | |
| ICICI Bank Ltd. | 0.95 | |
| State Bank Of India | 0.82 | |
| Bank Of Baroda | 0.66 | |
| Axis Bank Ltd. | 0.59 | |
| INDIAN BANK | 0.30 | |
| IT - Software | 3.14 | |
| Infosys Ltd. | 1.59 | |
| Tech Mahindra Ltd. | 0.97 | |
| Mphasis Ltd | 0.38 | |
| HEXAWARE TECHNOLOGIES LTD. | 0.20 | |
| Automobiles | 2.26 | |
| Maruti Suzuki India Limited | 1.36 | |
| Hero MotoCorp Ltd. | 0.90 | |
| Diversified FMCG | 1.25 | |
| Hindustan Unilever Ltd. | 0.96 | |
| ITC Ltd. | 0.29 | |
| Finance | 1.25 | |
| Power Finance Corporation Ltd. | 0.87 | |
| POONAWALLA FINCORP LTD. | 0.31 | |
| JIO FINANCIAL SERVICES LTD | 0.07 | |
| Petroleum Products | 1.24 | |
| HINDUSTAN PETROLEUM CORPORATION LTD | 0.67 | |
| RELIANCE INDUSTRIES LTD. | 0.57 | |
| Telecom - Services | 1.23 | |
| Bharti Airtel Ltd | 1.18 | |
| Bharti Airtel Ltd - Partly Paid Shares | 0.05 | |
| Consumer Durables | 0.88 | |
| Pokarna Ltd. | 0.57 | |
| Century Plyboards (India) Ltd. | 0.31 | |
| Power | 0.85 | |
| NTPC LTD | 0.85 | |
| Pharmaceuticals and Biotechnology | 0.84 | |
| Cipla Ltd. | 0.42 | |
| JB CHEMICALS & PHARMACEUTICALS LTD. | 0.42 | |
| Gas | 0.63 | |
| GAIL (India) Ltd. | 0.63 | |
| Beverages | 0.58 | |
| Radico Khaitan Ltd. | 0.33 | |
| UNITED SPIRITS LTD. | 0.25 | |
| Retailing | 0.41 | |
| SWIGGY LTD | 0.22 | |
| BRAINBEES SOLUTIONS LIMITED | 0.19 | |
| Industrial Manufacturing | 0.40 | |
| JYOTI CNC AUTOMATION LTD | 0.26 | |
| DEE DEVELOPMENT ENGINEEERS LTD | 0.08 | |
| JNK INDIA LIMITED | 0.06 | |
| Auto Components | 0.39 | |
| Subros Ltd. | 0.39 | |
| Capital Markets | 0.35 | |
| BSE LTD. | 0.35 | |
| Cement and Cement Products | 0.31 | |
| Ambuja Cements Ltd. | 0.31 | |
| Insurance | 0.24 | |
| LIFE INSURANCE CORPORATION OF INDIA LTD. | 0.24 | |
| Agricultural, Commercial and Constr | 0.23 | |
| V.S.T Tillers Tractors Ltd | 0.23 | |
| Food Products | 0.23 | |
| Britannia Industries Ltd. | 0.23 | |
| Healthcare Services | 0.17 | |
| Fortis Healthcare India Ltd | 0.17 | |
| Leisure Services | 0.16 | |
| Jubilant Foodworks Limited | 0.16 | |
| Personal Products | 0.10 | |
| Dabur India Ltd. | 0.10 | |
| Realty | 0.08 | |
| Mahindra Lifespace Developers Ltd | 0.08 | |
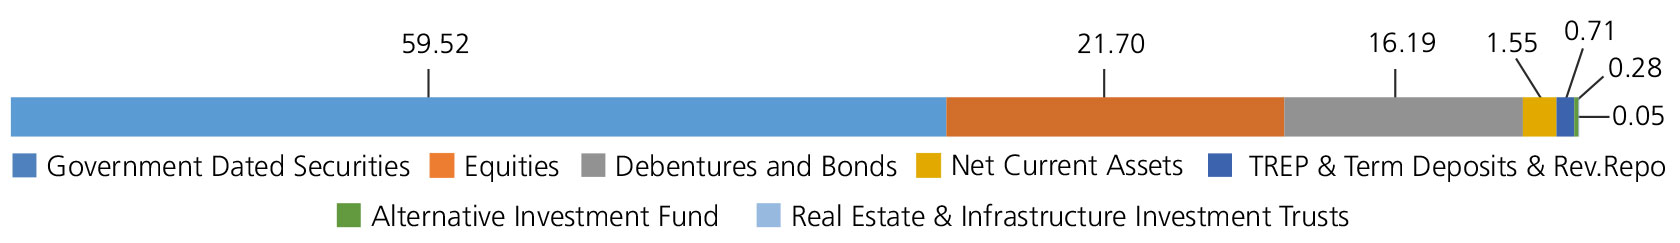
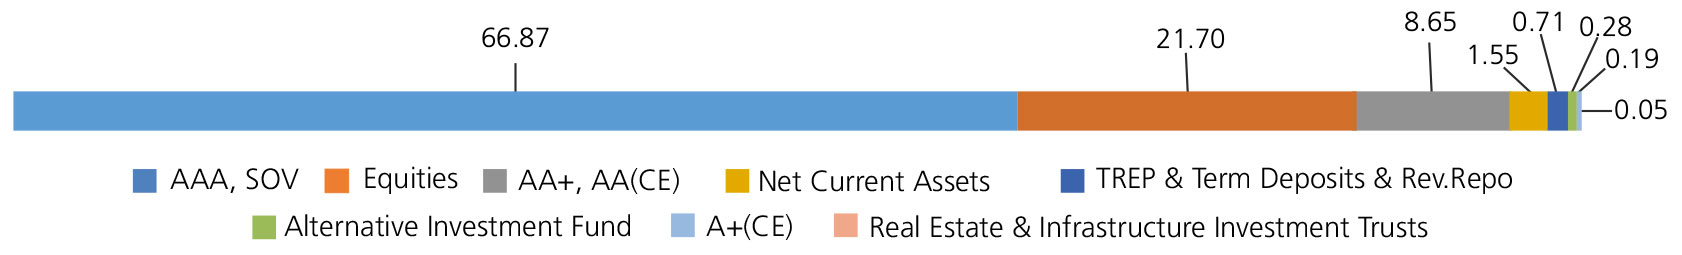
| Equity & Equity related - Total | 21.70 | |
| Debt Instruments | ||
| Debentures and Bonds | ||
| Government Dated Securities | ||
| 7.30% Central Government(^) | SOV | 15.74 |
| 7.34% Central Government | SOV | 10.92 |
| 7.02% Central Government | SOV | 6.82 |
| 6.79% Central Government | SOV | 5.40 |
| 7.09% Central Government | SOV | 5.18 |
| 7.18% Central Government(^) | SOV | 3.72 |
| 7.32% Central Government(^) | SOV | 3.65 |
| 7.17% Central Government | SOV | 1.97 |
| 7.25% Central Government | SOV | 1.53 |
| 7.45% Maharashtra State Govt-Maharashtra | SOV | 1.38 |
| GS CG 25/11/2035 - (STRIPS) | SOV | 0.50 |
| 7.95% Central Government | SOV | 0.34 |
| GS CG 22/10/2032 - (STRIPS) | SOV | 0.31 |
| GS CG 06/05/2038 - (STRIPS) | SOV | 0.28 |
| 7.65% Madhya Pradesh State Govt-Madhya Pradesh | SOV | 0.17 |
| GS CG 22/04/2036 - (STRIPS) | SOV | 0.16 |
| GS 5.63% CG 12/04/2026 - (STRIPS) | SOV | 0.16 |
| 6.57% Andhra Pradesh State Govt-Andhra Pradesh | SOV | 0.16 |
| 7.96% Punjab State Govt-Punjab | SOV | 0.10 |
| 7.84% Maharashtra State Govt-Maharashtra | SOV | 0.10 |
| GS CG 25/05/2036 - (STRIPS) | SOV | 0.09 |
| 7.96% Maharashtra State Govt-Maharashtra | SOV | 0.09 |
| GS CG 25/05/2038 - (STRIPS) | SOV | 0.08 |
| GS CG 25/05/2037 - (STRIPS) | SOV | 0.08 |
| GS CG 25/05/2040 - (STRIPS) | SOV | 0.07 |
| 8.05% Tamil Nadu State Govt-Tamil Nadu | SOV | 0.07 |
| GS CG 25/11/2038 - (STRIPS) | SOV | 0.07 |
| GS CG 25/11/2040 - (STRIPS) | SOV | 0.06 |
| GS CG 25/05/2041 - (STRIPS) | SOV | 0.06 |
| 8.29% Andhra Pradesh State Govt-Andhra Pradesh | SOV | 0.06 |
| GS CG 22 Aug 2026 - (STRIPS) | SOV | 0.05 |
| 7.98% Kerala State Govt-Kerala | SOV | 0.05 |
| 7.26% Central Government(^) | SOV | 0.04 |
| GS CG 23/12/2025 - (STRIPS) | SOV | 0.03 |
| GS CG 22 Feb 2027 - (STRIPS) | SOV | 0.03 |
| Government Dated Securities - Total | 59.52 | |
| Public Sector Undertakings | ||
| TELANGANA STATE INDUSTRIAL INFRASTRUCTURE CORPORATION LTD. | FITCH AA(CE) | 4.43 |
| NATIONAL BANK FOR AGRICULTURE & RURAL DEVELOPMENT | CRISIL AAA | 2.05 |
| REC LTD | CRISIL AAA | 1.98 |
| Power Finance Corporation Ltd. (^) | CRISIL AAA | 1.12 |
| SMALL INDUSTRIES DEVELOPMENT BANK OF INDIA | ICRA AAA | 0.67 |
| Power Finance Corporation Ltd. | CRISIL AAA | 0.39 |
| INDIAN RAILWAY FINANCE CORPORATION LTD. | CRISIL AAA | 0.25 |
| U P Power Corporation Ltd ( Guaranteed By UP State Government ) | CRISIL A+(CE) | 0.19 |
| Power Grid Corporation of India Ltd. | CRISIL AAA | 0.19 |
| Public Sector Undertakings - Total | 11.27 | |
| Corporate Debt/Financial Institutions | ||
| BHARTI TELECOM LTD. | CRISIL AA+ | 4.22 |
| LIC HOUSING FINANCE LTD. | CRISIL AAA | 0.17 |
| Larsen and Toubro Ltd. | CRISIL AAA | 0.17 |
| HDB Financial Services Ltd. | CRISIL AAA | 0.17 |
| ADITYA BIRLA FINANCE LTD. | ICRA AAA | 0.17 |
| Mahindra & Mahindra Financial Services Ltd. | CRISIL AAA | 0.02 |
| Corporate Debt/Financial Institutions - Total | 4.92 | |
| Triparty Repo | 0.71 | |
| Alternative Investment Fund | ||
| CORPORATE DEBT MARKET DEVELOPMENT FUND - CLASS A2 | Alternative Investment Fund | 0.28 |
| Alternative Investment Fund - Total | 0.28 | |
| Real Estate & Infrastructure Investment Trusts | ||
| INDUS INFRA TRUST | Transport Infrastructure | 0.05 |
| Real Estate & Infrastructure Investment Trusts - Total | 0.05 | |
| Net Current Assets/(Liabilities) | 1.55 | |
| Grand Total | 100.00 | |
| | ||
| Monthly SIP of (Rs) 10000 | Since Inception | 10 years | 7 years | 5 years | 3 years | 1 year |
| Total amount invested (₹) | 25,50,000 | 12,00,000 | 8,40,000 | 6,00,000 | 3,60,000 | 1,20,000 |
| Total Value as on Feb 28, 2025 (₹) | 72,04,801 | 19,56,962 | 11,95,666 | 7,64,134 | 4,11,093 | 1,19,773 |
| Scheme Returns (%) | 8.87 | 9.46 | 9.93 | 9.62 | 8.83 | -0.35 |
| CRISIL Hybrid 85+15 - Conservative Index Returns (%) | 8.59 | 8.33 | 8.22 | 7.73 | 8.06 | 3.60 |
| Alpha* | 0.28 | 1.13 | 1.71 | 1.90 | 0.78 | -3.95 |
| CRISIL Hybrid 85+15 - Conservative Index (₹)# | 69,55,365 | 18,44,274 | 11,24,946 | 7,28,818 | 4,06,408 | 1,22,293 |
| CRISIL 10 Year Gilt Index (₹)^ | 53,35,847 | 16,58,624 | 10,54,917 | 7,03,862 | 4,08,633 | 1,25,600 |
| CRISIL 10 Year Gilt Index Returns (%) | 6.44 | 6.31 | 6.41 | 6.33 | 8.43 | 8.86 |
| Regular | Direct | |
| Growth | Rs55.0907 | Rs63.3256 |
| Monthly IDCW | Rs12.5346 | Rs13.6566 |
A) Regular Plan B) Direct Plan
Options: Payout of IDCW, Reinvestment of
IDCW & Growth (applicable for all plans)
| Fund Manager* | Mr. Shibani Sircar Kurian & Mr. Abhishek Bisen |
| Benchmark | CRISIL Hybrid 85+15- Conservative Index |
| Allotment date | December 02, 2003 |
| AAUM | Rs3,028.05 crs |
| AUM | Rs2,975.06 crs |
| Folio count | 53,167 |
Monthly (12th of every Month)
| Average Maturity | 17.38 yrs |
| Modified Duration | 7.89 yrs |
| Macaulay Duration | 8.18 yrs |
| Annualised YTM* | 7.29% |
| $Standard Deviation | 4.93% |
| ^^P/E$$ | 16.61 |
| ^^P/BV$$ | 2.78 |
$$Equity Component of the Portfolio.
Initial & Additional Investment
• Rs100 and any amount thereafter
Systematic Investment Plan (SIP)
• Rs 100 and any amount thereafter
• 3 years & above
Entry Load: Nil. (applicable for all plans)
Exit Load:
• For redemption / switch out of upto 8% of
the initial investment amount (limit)
purchased or switched in within 6 months
from the date of allotment: Nil.
• If units redeemed or switched out are in
excess of the limit within 6 months from the
date of allotment: 1%
• If units are redeemed or switched out after
6 months from the date of allotment: NIL
| Regular Plan: | 1.67% |
| Direct Plan: | 0.45% |
Folio Count data as on 31st January 2025.
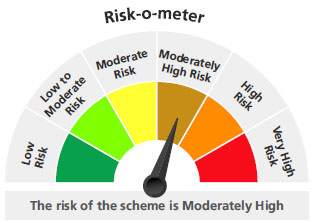
Fund
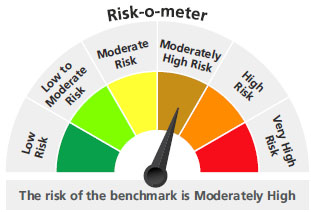
Benchmark: CRISIL Hybrid 85+15- Conservative Index
This product is suitable for investors who are seeking*:
- Income & capital growth over a long term horizon
- Investment in a portfolio of debt instruments with a moderate exposure in equity & equity related instruments
* Investors should consult their financial advisors if in doubt about whether the product is suitable for them.
The above risk-o—meter is based on the scheme portfolio as on 31st January, 2025. An addendum may be issued or updated on the website for new riskometer.
## Risk rate assumed to be 6.40% (FBIL Overnight MIBOR rate as on 28th Feb 2025).**Total Expense Ratio includes applicable B30 fee and GST.
* For Fund Manager experience, please refer 'For Regular Plan' & 'For Direct Plan'
For last three IDCW, please refer 'Dividend History'.
For scheme performance, please refer 'For Regular Plan' & 'For Direct Plan'