Mid Cap Fund - An open ended equity scheme predominantly investing in mid cap stocks
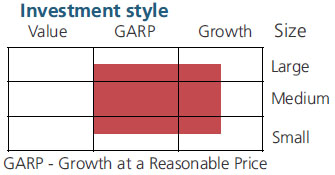
Mid Cap Fund - An open ended equity scheme predominantly investing in mid cap stocks
 |
 |
 
|
|
|
|
| Issuer/Instrument | |
% to Net Assets |
|---|---|---|
| Equity & Equity related |
||
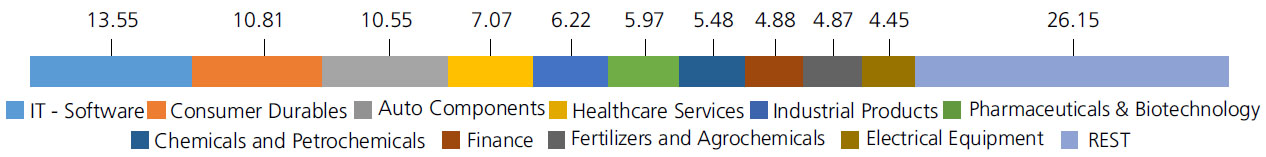
| IT - Software | 13.55 | |
| Mphasis Ltd | 2.98 | |
| Oracle Financial Services Software Ltd | 2.70 | |
| PERSISTENT SYSTEMS LIMITED | 2.59 | |
| Wipro Ltd. | 2.32 | |
| Birlasoft Ltd. | 1.74 | |
| Tech Mahindra Ltd. | 0.73 | |
| HEXAWARE TECHNOLOGIES LTD. | 0.49 | |
| Consumer Durables | 10.81 | |
| Dixon Technologies India Ltd. | 2.39 | |
| BLUE STAR LTD. | 2.18 | |
| Metro Brands Ltd. | 1.62 | |
| Voltas Ltd. | 1.44 | |
| Kajaria Ceramics Ltd. | 1.25 | |
| Amber Enterprises India Ltd. | 1.16 | |
| V-Guard Industries Ltd. | 0.77 | |
| Auto Components | 10.55 | |
| Schaeffler India Ltd | 2.02 | |
| Exide Industries Ltd | 1.77 | |
| Bharat Forge Ltd. | 1.35 | |
| UNO MINDA LIMITED | 1.28 | |
| MRF Limited | 1.02 | |
| ZF Commercial Vehicle Control Systems India Limited | 0.89 | |
| Apollo Tyres Ltd. | 0.88 | |
| Balkrishna Industries Ltd. | 0.75 | |
| Sundaram Fasteners Ltd. | 0.59 | |
| Healthcare Services | 7.07 | |
| Fortis Healthcare India Ltd | 3.45 | |
| Global Health Ltd. | 1.96 | |
| MAX HEALTHCARE INSTITUTE LTD. | 1.66 | |
| Industrial Products | 6.22 | |
| SUPREME INDUSTRIES LIMITED | 1.84 | |
| KEI INDUSTRIES LTD. | 1.26 | |
| Polycab India Ltd. | 1.06 | |
| Ratnamani Metals & Tubes Ltd. | 1.06 | |
| APL APOLLO TUBES LTD. | 1.00 | |
| Pharmaceuticals and Biotechnology | 5.97 | |
| Ipca Laboratories Ltd. | 3.39 | |
| JB CHEMICALS & PHARMACEUTICALS LTD. | 1.46 | |
| Torrent Pharmaceuticals Ltd. | 1.12 | |
| Chemicals and Petrochemicals | 5.48 | |
| SOLAR INDUSTRIES INDIA LIMITED | 2.19 | |
| Deepak Nitrite Ltd. | 1.68 | |
| SRF Ltd. | 1.61 | |
| Finance | 4.88 | |
| Power Finance Corporation Ltd. | 1.96 | |
| LIC Housing Finance Ltd. | 1.43 | |
| Mahindra & Mahindra Financial Services Ltd. | 0.90 | |
| REC LTD | 0.59 | |
| Fertilizers and Agrochemicals | 4.87 | |
| Coromandel International Ltd. | 2.93 | |
| P I Industries Ltd | 1.94 | |
| Electrical Equipment | 4.45 | |
| GE VERNOVA T&D INDIA LIMITED | 1.99 | |
| Apar Industries Limited | 1.24 | |
| Thermax Ltd. | 1.22 | |
| Cement and Cement Products | 3.85 | |
| JK Cement Ltd. | 2.55 | |
| The Ramco Cements Ltd | 1.30 | |
| Insurance | 2.77 | |
| ICICI Lombard General Insurance Company Ltd | 1.64 | |
| Max Financial Services Ltd. | 1.13 | |
| Realty | 2.71 | |
| Oberoi Realty Ltd | 2.71 | |
| Capital Markets | 2.67 | |
| NUVAMA WEALTH MANAGEMENT LIMITED | 1.01 | |
| BSE LTD. | 0.95 | |
| Prudent Corporate Advisory Services Ltd. | 0.71 | |
| Telecom - Services | 2.16 | |
| BHARTI HEXACOM LTD. | 2.16 | |
| Aerospace and Defense | 1.88 | |
| Bharat Electronics Ltd. | 1.88 | |
| Petroleum Products | 1.62 | |
| HINDUSTAN PETROLEUM CORPORATION LTD | 1.62 | |
| Banks | 1.42 | |
| FEDERAL BANK LTD. | 1.42 | |
| Personal Products | 1.40 | |
| Emami Ltd. | 1.40 | |
| Oil | 1.19 | |
| OIL INDIA LIMITED | 1.19 | |
| Retailing | 1.04 | |
| ZOMATO LTD. | 0.85 | |
| VISHAL MEGA MART LIMITED | 0.19 | |
| Power | 0.66 | |
| NTPC GREEN ENERGY LIMITED | 0.66 | |
| Construction | 0.56 | |
| TECHNO ELECTRIC & ENGINEERING COMPANY LIMITED | 0.56 | |
| Equity & Equity related - Total | 97.78 | |
| Mutual Fund Units | ||
| Kotak Liquid Direct Growth | 0.24 | |
| Mutual Fund Units - Total | 0.24 | |
| Triparty Repo | 2.26 | |
| Net Current Assets/(Liabilities) | -0.28 | |
| Grand Total | 100.00 | |
Note: Large Cap, Midcap, Small cap and Debt and Money Market stocks as a % age of Net Assets: 11.17, 69.38, 17.23 & 2.22.
| Monthly SIP of (₹) 10000 | Since Inception | 10 years | 7 years | 5 years | 3 years | 1 year |
| Total amount invested (₹) | 21,60,000 | 12,00,000 | 8,40,000 | 6,00,000 | 3,60,000 | 1,20,000 |
| Total Value as on Feb 28, 2025 (₹) | 1,25,82,058 | 29,52,955 | 16,52,453 | 9,69,843 | 4,35,684 | 1,06,219 |
| Scheme Returns (%) | 17.27 | 17.16 | 19.00 | 19.31 | 12.82 | -20.78 |
| Nifty Midcap 150 (TRI) Returns (%) | 17.13 | 18.11 | 20.29 | 21.53 | 15.17 | -22.22 |
| Alpha* | 0.14 | -0.95 | -1.29 | -2.22 | -2.35 | 1.45 |
| Nifty Midcap 150 (TRI) (₹)# | 1,23,90,222 | 31,08,295 | 17,29,938 | 10,23,336 | 4,50,601 | 1,05,218 |
| Nifty Midcap 100 (TRI) Returns (%) | 16.30 | 17.30 | 20.26 | 22.30 | 15.99 | -22.12 |
| Alpha* | 0.96 | -0.14 | -1.26 | -2.99 | -3.17 | 1.35 |
| Nifty Midcap 100 (TRI) (₹)# | 1,13,21,874 | 29,74,725 | 17,28,216 | 10,42,735 | 4,55,881 | 1,05,289 |
| Nifty 50 (TRI) (₹)^ | 73,30,548 | 23,61,941 | 13,44,619 | 8,34,267 | 4,10,521 | 1,12,215 |
| Nifty 50 (TRI) Returns (%) | 12.28 | 13.00 | 13.22 | 13.16 | 8.74 | -11.93 |
| Regular | Direct | |
| Growth | Rs108.7740 | Rs125.4160 |
| IDCW | Rs59.7420 | Rs74.7210 |
A) Regular Plan B) Direct Plan
Options: Payout of IDCW, Reinvestment of
IDCW & Growth (applicable for all plans)
| Fund Manager* |
Mr. Atul Bhole |
| Benchmark*** | NIFTY Midcap 150 TRI (Tier 1), Nifty Midcap 100 TRI (Tier 2) |
| Allotment date | March 30, 2007 |
| AAUM | Rs47,148.49 crs |
| AUM | Rs43,941.48 crs |
| Folio count | 18,77,553 |
Trustee's Discretion
| Portfolio Turnover | 44.19% |
| $Beta | 0.89 |
| $Sharpe ## | 0.64 |
| $Standard Deviation | 15.96% |
| ^^(P/E) | 27.92 |
| ^^P/BV | 4.51 |
Initial & Additional Investment
• Rs100 and any amount thereafter
Systematic Investment Plan (SIP)
• Rs 100 and any amount thereafter
• 5 years & above
Entry Load: Nil. (applicable for all plans)
Exit Load:
• For redemption / switch out of upto 10%
of the initial investment amount (limit)
purchased or switched in within 1 year from
the date of allotment: Nil.
• If units redeemed or switched out are in
excess of the limit within 1 year from the
date of allotment: 1%
• If units are redeemed or switched out on
or after 1 year from the date of allotment:
NIL.
| Regular Plan: | 1.47% |
| Direct Plan: | 0.45% |
Folio Count data as on 31st January 2025.
Benchmark - Tier 1: Nifty Midcap 150 TRI
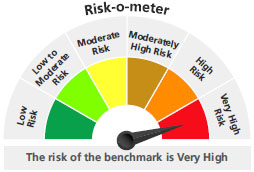
Benchmark - Tier 2: Nifty Midcap 100 TRI
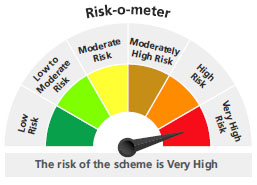
This product is suitable for investors who are seeking*:
- Long term capital growth
- Investment in equity & equity related securities predominantly in mid cap companies.
* Investors should consult their financial advisors if in doubt about whether the product is suitable for them.
The above risk-o—meter is based on the scheme portfolio as on 31st January, 2025. An addendum may be issued or updated on the website for new riskometer.
## Risk rate assumed to be 6.40% (FBIL Overnight MIBOR rate as on 28th Feb 2025).**Total Expense Ratio includes applicable B30 fee and GST.
* For Fund Manager experience, please refer 'For Regular Plan' & 'For Direct Plan'
For last three IDCW, please refer 'Dividend History'.
For scheme performance, please refer 'For Regular Plan' & 'For Direct Plan'