| KOTAK NIFTY 50 EQUAL WEIGHT INDEX FUND
An open-ended scheme replicating/tracking the Nifty 50 Equal Weight Index
An open-ended scheme replicating/tracking the Nifty 50 Equal Weight Index
| KOTAK NIFTY 50 EQUAL WEIGHT INDEX FUND
An open-ended scheme replicating/tracking the Nifty 50 Equal Weight Index
An open-ended scheme replicating/tracking the Nifty 50 Equal Weight Index
 |
 |
 
|
|
|
|
Investment Objective
The investment objective of the scheme is to provide returns that, before expenses, corresponding to the total returns of the securities as represented by the
underlying index, subject to tracking errors. There is no assurance that the investment objective of the Scheme will be achieved.
The investment objective of the scheme is to provide returns that, before expenses, corresponding to the total returns of the securities as represented by the
underlying index, subject to tracking errors. There is no assurance that the investment objective of the Scheme will be achieved.
| Issuer/Instrument | |
% to Net Assets |
|---|---|---|
| Equity & Equity Related | ||
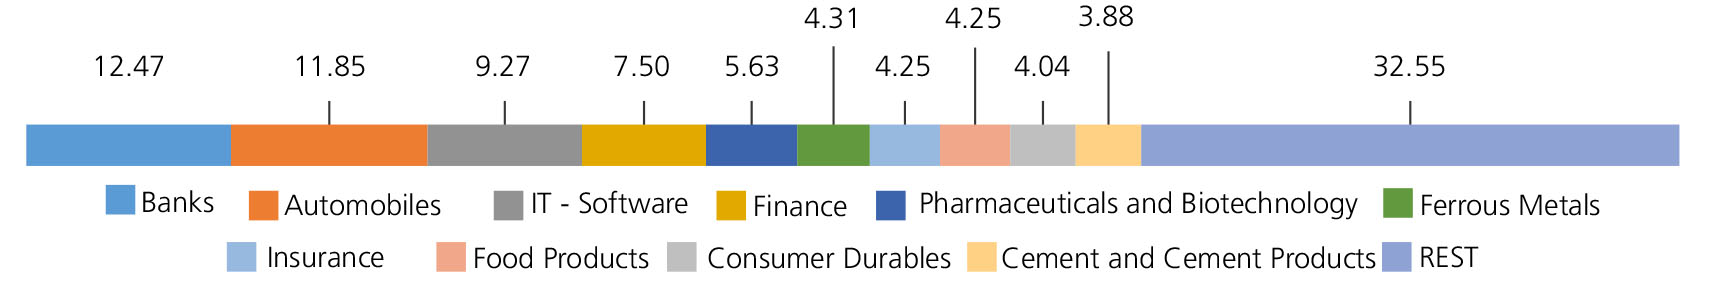
| Banks | 12.47 | |
| Kotak Mahindra Bank Ltd. | 2.32 | |
| IndusInd Bank Ltd. | 2.27 | |
| HDFC Bank Ltd. | 2.07 | |
| Axis Bank Ltd. | 2.02 | |
| ICICI Bank Ltd. | 1.98 | |
| State Bank Of India | 1.81 | |
| Automobiles | 11.85 | |
| Maruti Suzuki India Limited | 2.34 | |
| Eicher Motors Ltd. | 2.12 | |
| Bajaj Auto Ltd. | 1.90 | |
| Mahindra & Mahindra Ltd. | 1.86 | |
| Hero MotoCorp Ltd. | 1.84 | |
| Tata Motors Ltd. | 1.79 | |
| IT - Software | 9.27 | |
| Wipro Ltd. | 1.95 | |
| Infosys Ltd. | 1.89 | |
| Tech Mahindra Ltd. | 1.87 | |
| Tata Consultancy Services Ltd. | 1.79 | |
| HCL Technologies Ltd. | 1.77 | |
| Finance | 7.50 | |
| Bajaj Finance Ltd. | 2.68 | |
| Bajaj Finserv Ltd. | 2.57 | |
| SHRIRAM FINANCE LTD. | 2.25 | |
| Pharmaceuticals and Biotechnology | 5.63 | |
| Cipla Ltd. | 2.02 | |
| Sun Pharmaceuticals Industries Ltd. | 1.85 | |
| DR REDDYS LABORATORIES LTD. | 1.76 | |
| Ferrous Metals | 4.31 | |
| JSW Steel Ltd. | 2.22 | |
| Tata Steel Ltd. | 2.09 | |
| Food Products | 4.25 | |
| NESTLE INDIA LTD. | 2.18 | |
| Britannia Industries Ltd. | 2.07 | |
| Insurance | 4.25 | |
| SBI Life Insurance Company Ltd | 2.17 | |
| HDFC Life Insurance Company Ltd. | 2.08 | |
| Consumer Durables | 4.04 | |
| Asian Paints Ltd. | 2.06 | |
| Titan Company Ltd. | 1.98 | |
| Cement and Cement Products | 3.88 | |
| Grasim Industries Ltd. | 1.99 | |
| Ultratech Cement Ltd. | 1.89 | |
| Petroleum Products | 3.83 | |
| RELIANCE INDUSTRIES LTD. | 2.11 | |
| Bharat Petroleum Corporation Ltd. | 1.72 | |
| Diversified FMCG | 3.78 | |
| Hindustan Unilever Ltd. | 2.01 | |
| ITC Ltd. | 1.77 | |
| Power | 3.72 | |
| NTPC LTD | 1.99 | |
| Power Grid Corporation Of India Ltd. | 1.73 | |
| Agricultural Food and other Product | 2.29 | |
| Tata Consumer Products Ltd | 2.29 | |
| Non - Ferrous Metals | 2.16 | |
| Hindalco Industries Ltd | 2.16 | |
| Telecom - Services | 2.10 | |
| Bharti Airtel Ltd | 2.10 | |
| Consumable Fuels | 2.04 | |
| Coal India Ltd. | 2.04 | |
| Oil | 2.00 | |
| Oil & Natural Gas Corporation Ltd. | 2.00 | |
| Metals and Minerals Trading | 1.87 | |
| Adani Enterprises Ltd. | 1.87 | |
| Construction | 1.86 | |
| Larsen And Toubro Ltd. | 1.86 | |
| Transport Infrastructure | 1.84 | |
| Adani Port and Special Economic Zone Ltd. | 1.84 | |
| Aerospace and Defense | 1.78 | |
| Bharat Electronics Ltd. | 1.78 | |
| Healthcare Services | 1.78 | |
| Apollo Hospitals Enterprises Ltd. | 1.78 | |
| Retailing | 1.47 | |
| Trent Ltd | 1.47 | |
| Equity & Equity Related - Total | 99.97 | |
| Net Current Assets/(Liabilities) | 0.03 | |
| Grand Total | 100.00 | |
Net Asset Value (NAV)
| Regular | Direct | |
| Growth | Rs9.3630 | Rs9.3720 |
| IDCW | Rs9.3630 | Rs9.3720 |
Available Plans/Options
A) Regular Plan B) Direct Plan
Options: a) Growth and Income
Distribution cum capital withdrawal
(IDCW) (Payout and Reinvestment)
| Fund Manager* | Mr. Devender Singhal, Mr. Satish Dondapati & Mr. Abhishek Bisen |
| Benchmark | Nifty 50 Equal Weight Index (TRI) |
| Allotment date | December 23, 2024 |
| AAUM | Rs9.22 crs |
| AUM | Rs8.63 crs |
| Folio count | 4,210 |
Ratios
| Portfolio Turnover | 24.21% |
| Tracking Error | 0.32% |
Minimum Investment Amount
Initial & Additional Investment
• Rs100 and any amount thereafter
Systematic Investment Plan (SIP)
• Rs 100 and any amount thereafter
Ideal Investments Horizon
• 5 years & above
IDCW Frequency
Trustee’s Discretion
Load Structure
Entry Load:
NIL. (applicable for all plans)
Exit Load:
NIL
Total Expense Ratio**
| Regular Plan: | 0.72% |
| Direct Plan: | 0.22% |
Data as on 28th February, 2025 unless
otherwise specified.
Folio Count data as on 31st January 2025.
Folio Count data as on 31st January 2025.
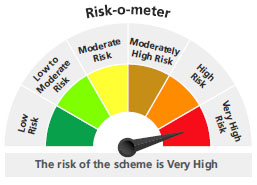
Fund
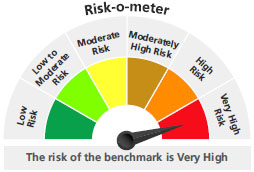
Benchmark : Nifty 50 Equal Weight Index (TRI)
This product is suitable for investors who are seeking*:
- Long term capital growth
- Return that corresponds to the performance of Nifty 50 Equal Weight Index subject to tracking error.
* Investors should consult their financial advisors if in doubt about whether the product is suitable for them.
The above risk-o—meter is based on the scheme portfolio as on 31st January, 2025. An addendum may be issued or updated on the website for new riskometer.
**Total Expense Ratio includes applicable B30 fee and GST.
The scheme has not completed 6 month since inception
* For Fund Manager experience, please refer 'For Regular Plan' & 'For Direct Plan'