| KOTAK BANKING AND PSU DEBT FUND
An open ended debt scheme predominantly investing in Debtinstruments of banks, Public Sector Undertakings, Public Financial Institutions and Municipal Bonds.
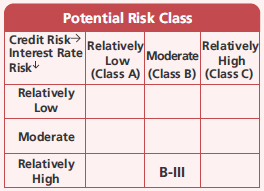
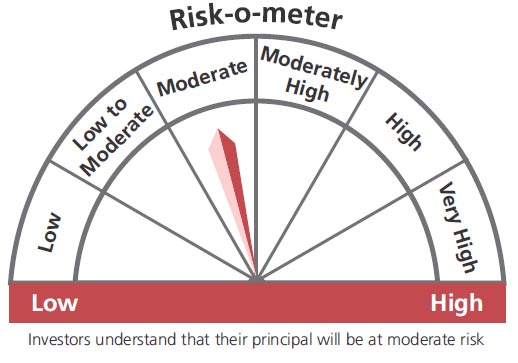
A relatively high interest rate risk and moderate credit risk.
An open ended debt scheme predominantly investing in Debtinstruments of banks, Public Sector Undertakings, Public Financial Institutions and Municipal Bonds.
A relatively high interest rate risk and moderate credit risk.
| KOTAK BANKING AND PSU DEBT FUND
An open ended debt scheme predominantly investing in Debtinstruments of banks, Public Sector Undertakings, Public Financial Institutions and Municipal Bonds.
A relatively high interest rate risk and moderate credit risk.
An open ended debt scheme predominantly investing in Debtinstruments of banks, Public Sector Undertakings, Public Financial Institutions and Municipal Bonds.
A relatively high interest rate risk and moderate credit risk.
 |
 |
 
|
|
|
|
Investment Objective
To generate income by predominantly
investing in debt & money market securities
issued by Banks, Public Sector Undertaking
(PSUs), Public Financial Institutions (PFI),
Municipal Bonds and Reverse repos in such
securities, sovereign securities issued by the
Central Government & State Governments,
and / or any security unconditionally
guaranteed by the Govt. of India. There is
no assurance that or guarantee that the
investment objective of the scheme will be
achieved.
| Issuer/Instrument | Industry/ Rating |
% to Net Assets |
|---|---|---|
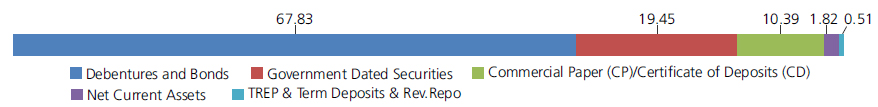
| Debt Instruments | ||
| Debentures and Bonds | ||
| Government Dated Securities | ||
| 7.42% Central Government(^) | SOV | 13.59 |
| 7.69% Central Government | SOV | 3.61 |
| 7.42% Central Government | SOV | 1.92 |
| 8.20% Central Government | SOV | 0.20 |
| 7.01% Central Government | SOV | 0.12 |
| 6.46% Gujarat State Govt-Gujarat | SOV | 0.01 |
| Government Dated Securities - Total | 19.45 | |
| Public Sector Undertakings | ||
| National Bank for Agriculture & Rural Development | CRISIL AAA | 9.17 |
| Power Finance Corporation Ltd.(^) | CRISIL AAA | 6.76 |
| DME Development Limited | CRISIL AAA | 6.10 |
| State Bank Of India.(Basel III TIER II Bonds) | CRISIL AAA | 6.06 |
| Small Industries Development Bank Of India | CRISIL AAA | 3.81 |
| Rural Electrification Corporation Ltd. | CRISIL AAA | 3.68 |
| National Bank for Agriculture & Rural Development | ICRA AAA | 2.96 |
| Bank Of Baroda(Basel III TIER II Bonds) | FITCH IND AAA | 2.96 |
| Small Industries Development Bank Of India | ICRA AAA | 2.83 |
| Union Bank of India(Basel III TIER I Bonds) | CARE AA | 2.72 |
| Indian Bank(Basel III TIER II Bonds) | FITCH IND AA+ | 2.26 |
| Punjab National Bank(Basel III TIER II Bonds) | CRISIL AA+ | 2.06 |
| Canara Bank(Basel III TIER I Bonds) | CRISIL AA+ | 1.90 |
| Canara Bank(Basel III TIER II Bonds) | FITCH IND AAA | 1.89 |
| Bank Of Baroda(Basel III TIER I Bonds) | CRISIL AA+ | 1.55 |
| Mangalore Refinery and Petrochemicals Ltd. | FITCH AAA(IND) | 0.92 |
| Bank Of Baroda(Basel III TIER II Bonds) | FITCH AAA(IND) | 0.25 |
| Public Sector Undertakings - Total | 57.88 | |
| Corporate Debt/Financial Institutions | ||
| HDFC Ltd.(^) | CRISIL AAA | 9.29 |
| AXIS Bank Ltd. | CRISIL AAA | 0.45 |
| ICICI Bank Ltd.(Basel III TIER I Bonds) | CRISIL AA+ | 0.21 |
| Corporate Debt/Financial Institutions - Total | 9.95 | |
| Money Market Instruments | ||
| Commercial Paper(CP)/Certificate of Deposits(CD) | ||
| Public Sector Undertakings | ||
| Export-Import Bank of India | CRISIL AAA | 2.63 |
| Small Industries Development Bank Of India | CARE A1+ | 1.35 |
| Bank Of Baroda | FITCH IND A1+ | 1.35 |
| Public Sector Undertakings - Total | 5.33 | |
| Corporate Debt/Financial Institutions | ||
| HDFC Bank Ltd. | CARE A1+ | 5.06 |
| Corporate Debt/Financial Institutions - Total | 5.06 | |
| Triparty Repo | 0.51 | |
| Net Current Assets/(Liabilities) | 1.82 | |
| Grand Total | 100 | |
| Monthly SIP of (₹) 10000 | Since Inception | 10 years | 7 years | 5 years | 3 years | 1 year |
| Total amount invested (₹) | 29,00,000 | 12,00,000 | 8,40,000 | 6,00,000 | 3,60,000 | 1,20,000 |
| Total Value as on Jan 31, 2023 (₹) | 74,39,704 | 17,35,044 | 10,61,033 | 6,99,905 | 3,85,516 | 1,22,985 |
| Scheme Returns (%) | 7.09 | 7.16 | 6.57 | 6.09 | 4.50 | 4.63 |
| CRISIL Banking and PSU Debt Index Returns (%) | NA | 7.18 | 6.42 | 5.87 | 4.24 | 4.46 |
| Alpha | NA | -0.02 | 0.15 | 0.23 | 0.25 | 0.17 |
| CRISIL Banking and PSU Debt Index (₹)# | NA | 17,36,666 | 10,55,411 | 6,95,894 | 3,84,056 | 1,22,874 |
| CRISIL 10 Year Gilt Index (₹)^ | NA | 16,00,033 | 9,90,915 | 6,67,961 | 3,71,294 | 1,23,021 |
| CRISIL 10 Year Gilt Index (%) | NA | 5.61 | 4.65 | 4.24 | 2.02 | 4.69 |
Scheme Inception : - December 29, 1998. The returns are calculated by XIRR approach assuming investment of ₹10,000/- on the 1st working day of every month. XIRR helps in calculating return on investments given an initial
and final value and a series of cash inflows and outflows and taking the time of investment into consideration. Since inception returns are assumed to be starting from the beginning of the subsequent month from the date of
inception. # Benchmark ; ^ Additional Benchmark.
Alpha is difference of scheme return with benchmark return.
Alpha is difference of scheme return with benchmark return.
NAV
| Growth Option | Rs54.406 |
| Direct Growth Option | Rs56.138 |
| Monthly-Reg-Plan-IDCW | Rs10.443 |
| Monthly-Dir-Plan-IDCW | Rs10.259 |
Available Plans/Options
A) Regular Plan B) Direct Plan
Options: Payout of IDCW, Reinvestment of
IDCW & Growth (applicable for all plans)
| Fund Manager* | Mr. Deepak Agrawal,
Mr. Abhishek Bisen &
Mr. Vihag Mishra (Dedicated fund manager for investments in foreign securities) |
| Benchmark | CRISIL Banking and PSU Debt Index |
| Allotment date | December 29,1998 |
| AAUM | Rs5,742.65 crs |
| AUM | Rs5,246.76 crs |
| Folio count | 18,957 |
IDCW Frequency
Monthly (12th of every Month)
Ratios
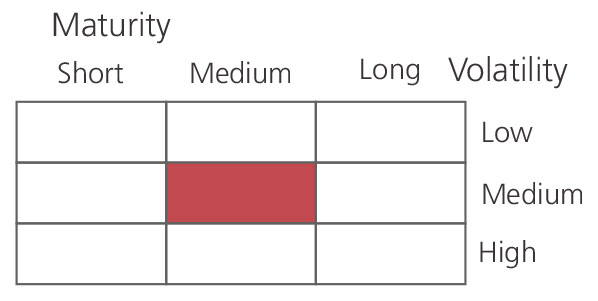
| Portfolio Average Maturity | 7.08 yrs |
| IRS Average Maturity* | -0.05 yrs |
| Net Average Maturity | 7.03 yrs |
| Portfolio Modified Duration | 2.73 yrs |
| IRS Modified Duration* | -0.02 yrs |
| Net Modified Duration | 2.71 yrs |
| Portfolio Macaulay Duration | 2.94 yrs |
| IRS Macaulay Duration* | -0.03 yrs |
| Net Macaulay Duration | 2.91 yrs |
| Annualised YTM* | 8.04% |
| $Standard Deviation | 1.29% |
*in case of semi annual YTM, it will be annualized.
Minimum Investment Amount
Initial Investment:Payout of IDCW,
Reinvestment of IDCW & Growth Rs5000 &
above.
Additional Investment: Rs1000 & in multiples
of Rs1
Ideal Investment Horizon: 2-3 years
Load Structure
Entry Load: Nil. (applicable for all plans)
Exit Load:
Nil. (applicable for all plans)
Total Expense Ratio**
Regular: 0.81%; Direct: 0.37%
Data as on January 31, 2023
Fund
Benchmark
This product is suitable for investors who are seeking*:
- Income over a short to medium term investment horizon.
- Investment in debt & money market securities of PSUs , Banks , Public Finanacial Institutions, government securities, and Municipal Bonds.
* Investors should consult their financial advisers if in doubt about whether the product is suitable for them.
The above risk-o—meter is based on the scheme portfolio as on 31st January 2023. An addendum may be issued or updated on the website for new riskometer
(^) Fully or Party blocked against Interest Rate Swap (IRS) Hedging Position through Interest Rate Swaps as on 31 Jan 2023 is 22.23% of the net assets.
**Total Expense Ratio includes applicable B30 fee and GST.
* For Fund Manager experience, please refer 'Our Fund Managers'
For last three IDCW, please refer 'Dividend History'.
For scheme performance, please refer 'Scheme Performances'