An open ended debt scheme predominantly investing in AA and below rated corporate bonds (Excluding AA+ rated corporate bonds).
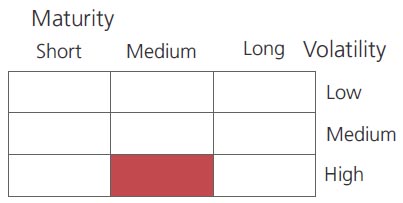
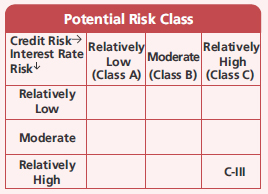
A relatively high interest rate risk and relatively high credit risk.
An open ended debt scheme predominantly investing in AA and below rated corporate bonds (Excluding AA+ rated corporate bonds).
A relatively high interest rate risk and relatively high credit risk.
 |
 |
 
|
|
|
|
| Issuer/Instrument | Industry/ Rating |
% to Net Assets |
|---|---|---|
| Mutual Fund Units | ||
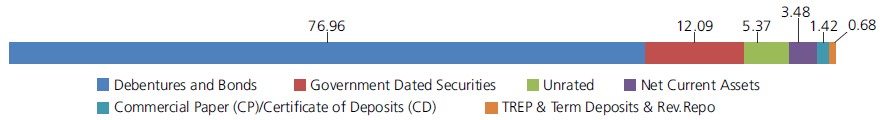
| Mutual Fund Units - Total | 5.37 | |
| Embassy Office Parks REIT | Realty | 4.07 |
| Brookfield India Real Estate Trust | Realty | 1.30 |
| Debt Instruments | ||
| Debentures and Bonds | ||
| Government Dated Securities | ||
| 7.42% Central Government | SOV | 8.56 |
| 7.38% Central Government | SOV | 1.81 |
| 5.74% Central Government | SOV | 1.72 |
| Government Dated Securities - Total | 12.09 | |
| Public Sector Undertakings | ||
| Power Finance Corporation Ltd. | CRISIL AAA | 6.34 |
| U P Power Corporation Ltd | CRISIL A+(CE) | 2.95 |
| THDC India Ltd. (THDCIL) | CARE AA | 1.79 |
| Public Sector Undertakings - Total | 11.08 | |
| Corporate Debt/Financial Institutions | ||
| GODREJ INDUSTRIES LTD | CRISIL AA | 9.54 |
| Tata Power Company Ltd. | CARE AA | 7.79 |
| Aadhar Housing Finance Limited | CARE AA | 7.06 |
| DLF Cyber City Developers Ltd | CRISIL AA | 6.98 |
| Bahadur Chand Investments Private Limited | ICRA AA | 5.40 |
| Tata Projects Ltd. | FITCH IND AA | 5.32 |
| Bajaj Housing Finance Ltd. | CRISIL AAA | 5.25 |
| Tata Motors Ltd. | CRISIL AA- | 3.67 |
| Vivriti Capital Private Limited | CARE A | 3.59 |
| JM Financial Products Limited | ICRA AA | 3.55 |
| AU Small Finance Bank Ltd. | CRISIL AA | 2.89 |
| Piramal Pharma Limited | CARE AA | 2.13 |
| Century Textiles & Industries Ltd. | CRISIL AA | 1.77 |
| MUTHOOT FINANCE LTD. | CRISIL AA+ | 0.94 |
| Corporate Debt/Financial Institutions - Total | 65.88 | |
| Money Market Instruments | ||
| Commercial Paper(CP)/Certificate of Deposits(CD) | ||
| Corporate Debt/Financial Institutions | ||
| Vedanta Ltd. | CRISIL A1+ | 1.42 |
| Corporate Debt/Financial Institutions - Total | 1.42 | |
| Triparty Repo | 0.68 | |
| Net Current Assets/(Liabilities) | 94.63 | |
| Net Current Assets/(Liabilities) | 5.37 | |
| Net Current Assets/(Liabilities) | 3.48 | |
| Grand Total | 100.00 | |
| Monthly SIP of (₹) 10000 | Since Inception | 10 years | 7 years | 5 years | 3 years | 1 year |
| Total amount invested (₹) | 15,30,000 | 12,00,000 | 8,40,000 | 6,00,000 | 3,60,000 | 1,20,000 |
| Total Value as on Jan 31, 2023 (₹) | 23,96,644 | 16,49,319 | 10,11,101 | 6,73,558 | 3,78,434 | 1,21,596 |
| Scheme Returns (%) | 6.76 | 6.19 | 5.22 | 4.57 | 3.27 | 2.47 |
| NIFTY Credit Risk Bond Index C-III Returns (%) | 9.10 | 8.83 | 8.42 | 8.39 | 7.80 | 7.88 |
| Alpha | -2.34 | -2.64 | -3.21 | -3.82 | -4.53 | -5.42 |
| NIFTY Credit Risk Bond Index C-III (₹)# | 28,15,631 | 18,94,326 | 11,33,676 | 7,41,390 | 4,05,016 | 1,25,057 |
| NIFTY Credit Risk Bond Index Returns (%) | 8.79 | 8.52 | 8.15 | 8.12 | 7.40 | 7.32 |
| Alpha | -2.03 | -2.33 | -2.94 | -3.55 | -4.13 | -4.85 |
| NIFTY Credit Risk Bond Index (₹)# | 27,56,662 | 18,63,370 | 11,22,778 | 7,36,296 | 4,02,636 | 1,24,699 |
| CRISIL 10 Year Gilt Index (₹)^ | 22,65,817 | 16,00,033 | 9,90,915 | 6,67,961 | 3,71,294 | 1,23,021 |
| CRISIL 10 Year Gilt Index (%) | 5.94 | 5.61 | 4.65 | 4.24 | 2.02 | 4.69 |
Alpha is difference of scheme return with benchmark return.
| Growth Option | Rs24.675 |
| Direct Growth Option | Rs27.133 |
| Annual-Reg-Plan-IDCW | Rs10.731 |
| Annual-Dir-Plan-IDCW | Rs20.380 |
A) Regular Plan B) Direct Plan
Options: Payout of IDCW, Reinvestment of
IDCW & Growth (applicable for all plans)
| Fund Manager* | : Mr. Deepak Agrawal,
Mr. Sunit Garg &
Mr. Vihag Mishra (Dedicated fund manager for investments in foreign securities) |
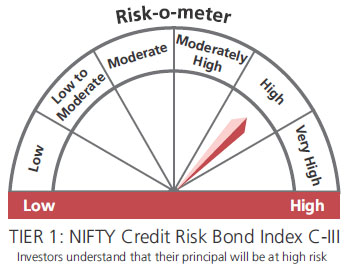
| Benchmark*** | Nifty Credit Risk Bond
Index C-III (Tier 1) Nifty Credit Risk Bond Index (Tier 2) |
| Allotment date | May 11, 2010 |
| AAUM | Rs1,400.90 crs |
| AUM | Rs1,387.18 crs |
| Folio count | 11,925 |
At discretion of trustees
| Portfolio Average Maturity | 2.99 yrs |
| IRS Average Maturity* | - |
| Net Average Maturity | 2.99 yrs |
| Portfolio Modified Duration | 1.67 yrs |
| IRS Modified Duration* | - |
| Net Modified Duration | 1.67 yrs |
| Portfolio Macaulay Duration | 1.79 yrs |
| IRS Macaulay Duration* | - |
| Net Macaulay Duration | 1.79 yrs |
| Annualised YTM* | 8.38% |
| $Standard Deviation | 2.80% |
*in case of semi annual YTM, it will be annualized.
Initial Investment:Rs5000 and in multiple
of Rs1 for purchase and for Rs0.01 for switches
Additional Investment: Rs1000 & in multiples of Rs1
Ideal Investments Horizon: 3 year & above
Entry Load: Nil. (applicable for all plans)
Exit Load: a) For redemption / switch out of
upto 6% of the initial investment amount
(limit) purchased or switched in within 1
year from the date of allotment: Nil.
b) If units redeemed or switched out are in
excess of the limit within 1 year from the
date of allotment: 1%
c) If units are redeemed or switched out on
or after 1 year from the date of allotment:
NIL
Regular: 1.71%; Direct: 0.74%
Fund
Benchmark
Benchmark

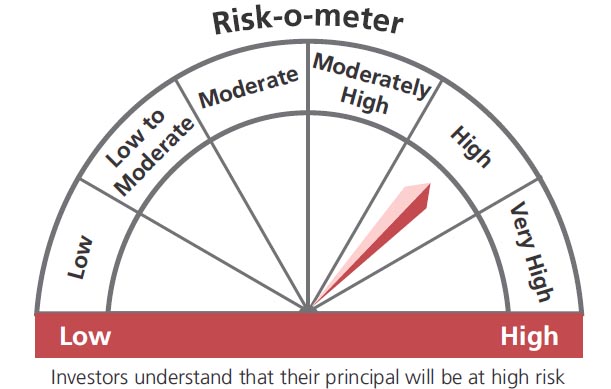
This product is suitable for investors who are seeking*:
- Income over a medium term investment horizon
- Investment predominantly in in AA and below rated corporate bonds (Excluding AA+ rated corporate bonds)
* Investors should consult their financial advisers if in doubt about whether the product is suitable for them.
The above risk-o—meter is based on the scheme portfolio as on 31st January 2023. An addendum may be issued or updated on the website for new riskometer
**Total Expense Ratio includes applicable B30 fee and GST.
***As per SEBI circular no. SEBI/HO/IMD/IMD-11 DF3/P/CIR/2021 /652 dated October 27, 2021; AMFI letter no. 35P/MEM-COR/70/2021-22 dated November 25, 2021 and AMFI letter no. 35P/ MEM-COR/ 131 / 2021-22 dated March 31, 2022 with effect from April 01, 2022 ("Effective date"), the first tier benchmark index of the scheme. Existing benchmark will be Second Tier benchmark for aforementioned scheme.
* For Fund Manager experience, please refer 'Our Fund Managers'
For last three IDCW, please refer 'Dividend History'.
For scheme performance, please refer 'Scheme Performances'