An open-ended hybrid scheme investing predominantly in debt instruments
An open-ended hybrid scheme investing predominantly in debt instruments
 |
 |
 
|
|
|
|

| Issuer/Instrument | Industry/ Rating |
% to Net Assets |
|
|---|---|---|---|
| Equity & Equity related |
|||
| Banks | 6.03 | ||
| HDFC Bank Ltd. | 1.65 | ||
| Bank Of Baroda | 1.02 | ||
| Axis Bank Ltd. | 0.78 | ||
| State Bank Of India | 0.72 | ||
| The South Indian Bank Ltd. | 0.51 | ||
| ICICI Bank Ltd. | 0.50 | ||
| Indian Bank | 0.46 | ||
| IndusInd Bank Ltd. | 0.39 | ||
| Diversified FMCG | 2.78 | ||
| ITC Ltd. | 2.23 | ||
| Hindustan Unilever Ltd. | 0.55 | ||
| Automobiles | 2.28 | ||
| Maruti Suzuki India Limited | 1.61 | ||
| Hero MotoCorp Ltd. | 0.67 | ||
| Petroleum Products | 1.94 | ||
| RELIANCE INDUSTRIES LTD. | 1.44 | ||
| Hindustan Petroleum Corporation Ltd | 0.50 | ||
| Consumer Durables | 1.25 | ||
| Kansai Nerolac Paints Ltd | 0.38 | ||
| Century Plyboards (India) Ltd. | 0.34 | ||
| Pokarna Ltd. | 0.34 | ||
| Bata India Ltd. | 0.19 | ||
| Finance | 1.11 | ||
| Power Finance Corporation Ltd. | 0.73 | ||
| Mahindra & Mahindra Financial Services Ltd. | 0.20 | ||
| Shriram Finance Ltd. | 0.18 | ||
| Power | 0.95 | ||
| National Thermal Power Corporation Limited | 0.95 | ||
| Leisure Services | 0.85 | ||
| Sapphire Foods India Ltd. | 0.44 | ||
| Jubilant Foodworks Limited | 0.22 | ||
| Barbeque Nation Hospitality Ltd. | 0.19 | ||
| Gas | 0.75 | ||
| GAIL (India) Ltd. | 0.75 | ||
| Personal Products | 0.68 | ||
| Emami Ltd. | 0.41 | ||
| Godrej Consumer Products Ltd. | 0.27 | ||
| Food Products | 0.63 | ||
| Prataap Snacks Ltd | 0.63 | ||
| Telecom - Services | 0.63 | ||
| Bharti Airtel Ltd | 0.60 | ||
| Bharti Airtel Ltd - Partly Paid Shares | 0.03 | ||
| Insurance | 0.61 | ||
| Max Financial Services Ltd. | 0.61 | ||
| IT - Software | 0.61 | ||
| Persistent Systems Limited | 0.41 | ||
| Infosys Ltd. | 0.20 | ||
| Beverages | 0.51 | ||
| United Spirits Ltd. | 0.27 | ||
| United Breweries Ltd. | 0.24 | ||
| Capital Markets | 0.50 | ||
| Prudent Corporate Advisory Services Ltd. | 0.50 | ||
| Entertainment | 0.41 | ||
| Zee Entertainment Enterprises Ltd | 0.41 | ||
| Auto Components | 0.37 | ||
| Subros Ltd. | 0.37 | ||
| Construction | 0.35 | ||
| PNC Infratech Ltd | 0.21 | ||
| KNR Constructions Ltd. | 0.14 | ||
| Healthcare Services | 0.34 | ||
| Fortis Healthcare India Ltd | 0.34 | ||
| Industrial Products | 0.28 | ||
| Ksb Ltd | 0.28 | ||
| Realty | 0.25 | ||
| Mahindra Lifespace Developers Ltd | 0.25 | ||
| Cement and Cement Products | 0.20 | ||
| Ultratech Cement Ltd. | 0.13 | ||
| JK Cement Ltd. | 0.07 | ||
| IT - Services | 0.19 | ||
| Firstsource Solutions Ltd. | 0.19 | ||
| Pharmaceuticals and Biotechnology | 0.05 | ||
| Zydus Lifesciences Limited | 0.05 | ||
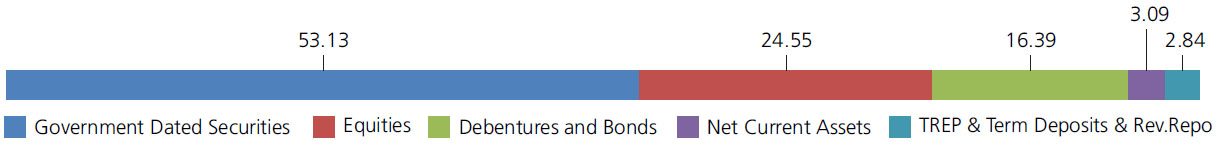
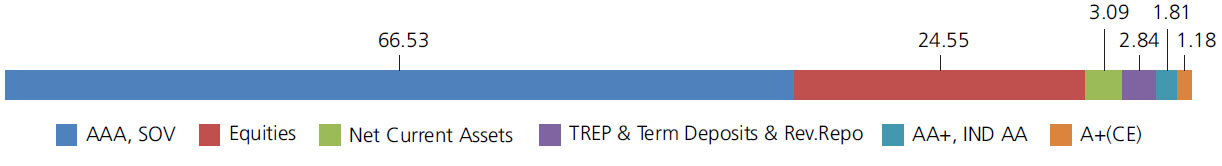
| Equity & Equity related - Total | 24.55 | ||
| Debt Instruments | |||
| Debentures and Bonds | |||
| Government Dated Securities | |||
| 7.42% Central Government | SOV | 13.71 | |
| 7.38% Central Government | SOV | 13.74 | |
| 7.10% Central Government(^) | SOV | 10.78 | |
| 7.01% Central Government | SOV | 3.51 | |
| 7.69% Central Government | SOV | 2.72 | |
| 7.26% Central Government | SOV | 1.80 | |
| 7.69% Central Government | SOV | 1.18 | |
| 5.74% Central Government | SOV | 1.15 | |
| GS CG 22 Aug 2028 - (STRIPS) | SOV | 1.00 | |
| 7.95% Central Government | SOV | 0.61 | |
| GS CG 17 Jun 2027 - (STRIPS) | SOV | 0.38 | |
| 7.65% Madhya Pradesh State Govt-Madhya Pradesh | SOV | 0.31 | |
| 8.27% Rajasthan State Govt-Rajasthan | SOV | 0.30 | |
| 6.57% Andhra Pradesh State Govt-Andhra Pradesh | SOV | 0.29 | |
| 8.42% Tamil Nadu State Govt-Tamil Nadu | SOV | 0.21 | |
| GS CG 22 Aug 2029 - (STRIPS) | SOV | 0.18 | |
| 7.84% Maharashtra State Govt-Maharashtra | SOV | 0.18 | |
| 7.96% Punjab State Govt-Punjab | SOV | 0.18 | |
| GS CG 22 Feb 2030 - (STRIPS) | SOV | 0.17 | |
| GS CG 22 Aug 2030 - (STRIPS) | SOV | 0.16 | |
| 9.15% Central Government | SOV | 0.13 | |
| 8.05% Tamil Nadu State Govt-Tamil Nadu | SOV | 0.12 | |
| GS CG 22 Aug 2026 - (STRIPS) | SOV | 0.08 | |
| GS CG 22 Feb 2029 - (STRIPS) | SOV | 0.07 | |
| GS CG 22 Feb 2028 - (STRIPS) | SOV | 0.07 | |
| GS CG 23/12/2025 - (STRIPS) | SOV | 0.05 | |
| GS CG 22 Feb 2027 - (STRIPS) | SOV | 0.05 | |
| Government Dated Securities - Total | SOV | 53.13 | |
| Public Sector Undertakings | |||
| National Bank for Agriculture & Rural Development | 5.89 | ||
| Small Industries Development Bank Of India | CRISIL AAA | 2.41 | |
| State Bank Of India.(Basel III TIER II Bonds) | ICRA AAA | 1.53 | |
| Power Finance Corporation Ltd. | CRISIL AAA | 1.37 | |
| U P Power Corporation Ltd | CRISIL AAA | 1.18 | |
| Rural Electrification Corporation Ltd. | CRISIL A+(CE) | 0.37 | |
| THDC India Ltd. (THDCIL) | CRISIL AAA | 0.30 | |
| Indian Railway Finance Corporation Ltd. | FITCH IND AA | 0.25 | |
| Power Grid Corporation of India Ltd. | CRISIL AAA | 0.11 | |
| Public Sector Undertakings - Total | CRISIL AAA | 13.41 | |
| Corporate Debt/Financial Institutions | |||
| Bharti Telecom Ltd. | 1.51 | ||
| EMBASSY OFFICE PARKS REIT | CRISIL AA+ | 1.47 | |
| Corporate Debt/Financial Institutions - Total | CRISIL AAA | 2.98 | |
| Triparty Repo | 2.84 | ||
| Net Current Assets/(Liabilities) | 3.09 | ||
| Grand Total | 100.00 | ||
| | |||
| Monthly SIP of (Rs) 10000 | Since Inception | 10 years | 7 years | 5 years | 3 years | 1 year |
| Total amount invested (Rs) | 23,00,000 | 12,00,000 | 8,40,000 | 6,00,000 | 3,60,000 | 1,20,000 |
| Total Value as on Jan 31, 2023 (Rs) | 56,16,808 | 19,32,722 | 11,57,894 | 7,64,026 | 4,12,833 | 1,23,804 |
| Scheme Returns (%) | 8.57 | 9.21 | 9.02 | 9.60 | 9.09 | 5.91 |
| CRISIL Hybrid 85+15 - Conservative Index Returns (%) | 8.49 | 8.44 | 7.81 | 7.56 | 5.93 | 4.91 |
| Alpha | 0.08 | 0.78 | 1.20 | 2.04 | 3.17 | 1.00 |
| CRISIL Hybrid 85+15 - Conservative Index (Rs)# | 55,68,421 | 18,55,160 | 11,09,197 | 7,26,106 | 3,93,872 | 1,23,165 |
| CRISIL 10 Year Gilt Index (Rs)^ | 42,43,575 | 16,00,033 | 9,90,915 | 6,67,961 | 3,71,294 | 1,23,021 |
| CRISIL 10 Year Gilt Index Returns (%) | 6.00 | 5.61 | 4.65 | 4.24 | 2.02 | 4.69 |
Alpha is difference of scheme return with benchmark return.
| Growth option | Rs44.627 |
| Direct Growth option | Rs49.970 |
| Monthly-Reg-Plan-IDCW | Rs12.174 |
| Monthly-Dir-Plan-IDCW | Rs13.052 |
A) Regular Plan B) Direct Plan
Options: Payout of IDCW, Reinvestment of
IDCW & Growth (applicable for all plans)
| Fund Manager* | Mr. Devender Singhal, Mr. Abhishek Bisen & Mr. Vihag Mishra (Dedicated fund manager for investments in foreign securities) |
| Benchmark | CRISIL Hybrid 85+15 - Conservative Index |
| Allotment date | December 02, 2003 |
| AAUM | Rs1,646.17 crs |
| AUM | Rs1,650.92 crs |
| Folio count | 27,539 |
Monthly (12th of every Month)
| Portfolio Average Maturity | 5.89 yrs |
| IRS Average Maturity* | -0.10 yrs |
| Net Average Maturity | 5.79 yrs |
| Portfolio Modified Duration | 2.58 yrs |
| IRS Modified Duration* | -0.08 yrs |
| Net Modified Duration | 2.50 yrs |
| Portfolio Macaulay Duration | 2.70 yrs |
| IRS Macaulay Duration* | -0.08 yrs |
| Net Macaulay Duration | 2.61 yrs |
| Annualised YTM* | 7.65% |
| $Standard Deviation | 5.04% |
*in case of semi annual YTM, it will be annualized.
Source: $ICRAMFI Explorer.
Standard Deviation is calculated on Annualised basis using 3 years history of monthly returns.
Initial Investment:
(i) Reinvestment of IDCW & Growth and Payout of IDCW (Quarterly) - Rs5000 & above
(ii) Payout of IDCW (Monthly) - Rs50,000 & above
Additional Investment: Rs1000 & in multiples of Rs1
Ideal Investments Horizon - 3 year & above
Entry Load: Nil. (applicable for all plans)
Exit Load: a) For redemption / switch out of upto 8%
of the initial investment amount (limit)
purchased or switched in within 6 months
from the date of allotment: Nil.
b) If units redeemed or switched out are in
excess of the limit within 6 months from the
date of allotment: 1%
c) If units are redeemed or switched out
after 6 months from the date of allotment:
NIL
Regular: 1.80%; Direct:0.44%
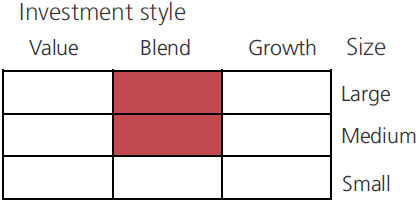
Fund
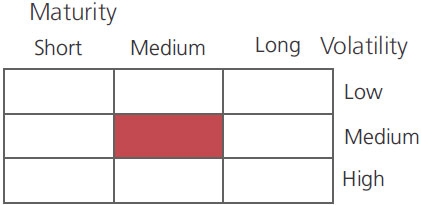
Benchmark
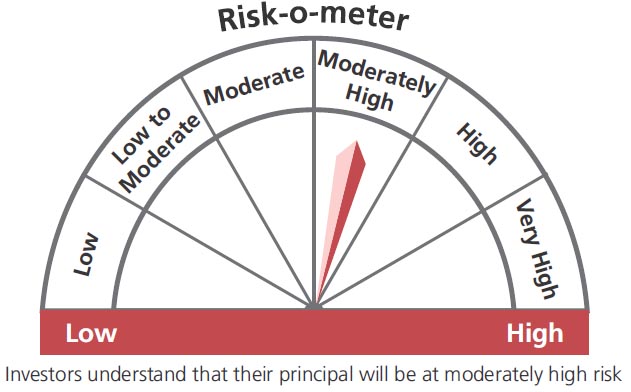
This product is suitable for investors who are seeking*:
- Income & capital growth over a long term horizon
- Investment in a portfolio of debt instruments with a moderate exposure in equity & equity related instruments
* Investors should consult their financial advisers if in doubt about whether the product is suitable for them.
The above risk-o—meter is based on the scheme portfolio as on 31st January 2023. An addendum may be issued or updated on the website for new riskometer
##Risk rate assumed to be 6.50% (FBIL Overnight MIBOR rate as on 31st January 2023).**Total Expense Ratio includes applicable B30 fee and GST.
* For Fund Manager experience, please refer 'Our Fund Managers'
For last three IDCW, please refer 'Dividend History'.
For scheme performance, please refer 'Scheme Performances'