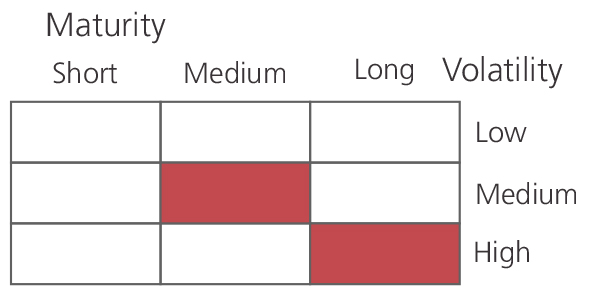
An open ended debt scheme investing in government securities across maturity.
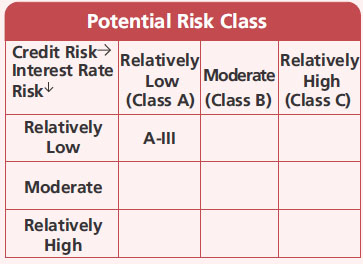
A relatively high interest rate risk and relatively low credit risk.
An open ended debt scheme investing in government securities across maturity.
A relatively high interest rate risk and relatively low credit risk.
 |
 |
 
|
|
|
|
| Issuer/Instrument | Industry/ Rating |
% to Net Assets |
|---|---|---|
| Government Dated Securities | ||
| 7.42% Central Government | SOV | 45.26 |
| 7.38% Central Government | SOV | 13.63 |
| 7.10% Central Government(^) | SOV | 12.09 |
| 7.69% Central Government | SOV | 4.69 |
| 7.26% Central Government | SOV | 3.43 |
| GS CG 22 Feb 2028 - (STRIPS) | SOV | 2.56 |
| GS CG 22 Aug 2029 - (STRIPS) | SOV | 2.47 |
| 7.69% Central Government | SOV | 2.45 |
| GS CG 22 Feb 2029 - (STRIPS) | SOV | 2.36 |
| GS CG 22 Aug 2028 - (STRIPS) | SOV | 1.62 |
| 7.62% Haryana State Govt-Haryana | SOV | 0.94 |
| 7.95% Central Government | SOV | 0.75 |
| GS CG 17 Jun 2027 - (STRIPS) | SOV | 0.46 |
| GS CG 17/12/2027 - (STRIPS) | SOV | 0.44 |
| GS CG 17/06/2028 - (STRIPS) | SOV | 0.42 |
| GS CG 17/12/2028 - (STRIPS) | SOV | 0.41 |
| GS CG 17/06/2029 - (STRIPS) | SOV | 0.39 |
| 7.68% Karnataka State Govt-Karnataka | SOV | 0.38 |
| 7.7% Maharashtra State Govt-Maharashtra | SOV | 0.32 |
| GS CG 22 Feb 2030 - (STRIPS) | SOV | 0.31 |
| 7.18% Tamil Nadu State Govt-Tamil Nadu | SOV | 0.31 |
| 7.15% Kerala State Govt-Kerala | SOV | 0.31 |
| GS CG 22 Aug 2030 - (STRIPS) | SOV | 0.30 |
| GS CG 22/02/2026 - (STRIPS) | SOV | 0.17 |
| GS CG 22 Aug 2026 - (STRIPS) | SOV | 0.17 |
| 7.91% Uttar Pradesh State Govt-Uttar Pradesh | SOV | 0.16 |
| GS CG 23/12/2025 - (STRIPS) | SOV | 0.15 |
| 6.57% Andhra Pradesh State Govt-Andhra Pradesh | SOV | 0.15 |
| 6.68% Haryana State Govt-Haryana | SOV | 0.09 |
| 6.78% Karnataka State Govt-Karnataka | SOV | 0.06 |
| 8.16% Gujarat State Govt-Gujarat | SOV | 0.02 |
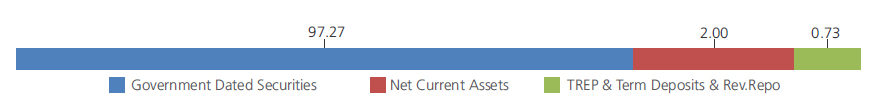
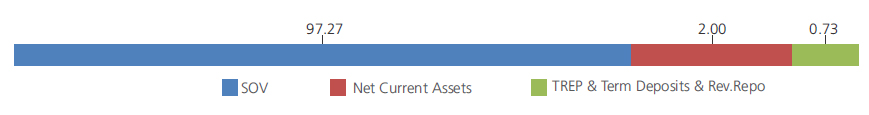
| Government Dated Securities - Total | 97.27 | |
| Triparty Repo | 0.73 | |
| Net Current Assets/(Liabilities) | 2.00 | |
| Grand Total | 100.00 | |
| Regular-Growth | Rs80.441 |
| Regular-Growth-Direct | Rs89.050 |
| Quarterly-Reg-Plan-IDCW | Rs15.718 |
| Quarterly-Dir-Plan-IDCW | Rs20.111 |
| PF & Trust-Growth | Rs82.296 |
| PF & Trust-Growth Direct | Rs91.190 |
| PF & Trust-Quarterly-Reg-Plan-IDCW | Rs11.704 |
A) Regular Non Direct Plan,
B) PF & Trust Non Direct Plan,
C) Regular Direct Plan,
D) PF & Trust Direct Plan.
Options: Payout of IDCW, Reinvestment of
IDCW & Growth (applicable for all plans)
| Fund Manager* | Mr. Abhishek Bisen &
Mr. Vihag Mishra (Dedicated fund manager for investments in foreign securities) |
| Benchmark | Nifty All Duration G-Sec Index |
| Allotment date | Regular Plan -
December 29, 1998; PF & Trust Plan - November 11, 2003 |
| AAUM | Rs1,766.99 crs |
| AUM | Rs1,594.14 crs |
| Folio count | 5,626 |
Quarterly (20th of Mar/Jun/Sep/Dec)
| Portfolio Average Maturity | 8.14 yrs |
| IRS Average Maturity* | -0.23 yrs |
| Net Average Maturity | 7.91 yrs |
| Portfolio Modified Duration | 2.24 yrs |
| IRS Modified Duration* | -0.19 yrs |
| Net Modified Duration | 2.05 yrs |
| Portfolio Macaulay Duration | 2.32 yrs |
| IRS Macaulay Duration* | -0.20 yrs |
| Net Macaulay Duration | 2.12 yrs |
| Annualised YTM* | 7.82% |
| $Standard Deviation (A) Reg. Plan (B) PF Trust Plan | 2.20% |
*in case of semi annual YTM, it will be annualized.
Initial Investment: Rs5000 and in multiple
of Rs1 for purchase and for Rs0.01 for
switches
Additional Investment: Rs1000 & in multiples
of Rs1
Ideal Investments Horizon: 2-3 years
Entry Load: (a) Regular Plan - Entry: Nil. (b) PF &
Trust Plan - Entry: Nil. (applicable for all plans)
Exit Load: (a) Regular Plan - Exit: Nil. (b) PF&Trust
Plan-Exit: Nil. (applicable for all plans)
Regular: 1.48%; Direct: 0.41%
Fund
Benchmark
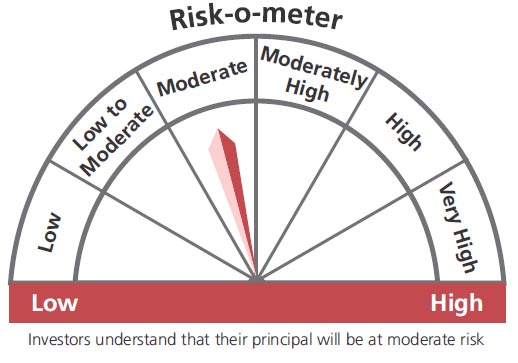
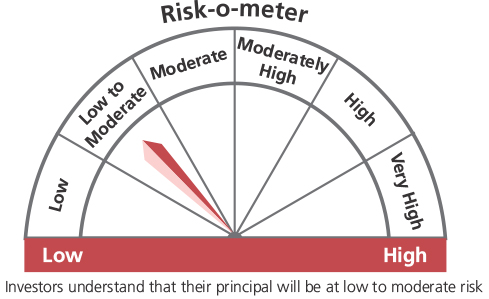
This product is suitable for investors who are seeking*:
- Income over a long investment horizon
- Investment in sovereign securities issued by the Central and/or State Government(s) and/or reverse repos in such securities
* Investors should consult their financial advisers if in doubt about whether the product is suitable for them.
The above risk-o—meter is based on the scheme portfolio as on 31st January 2023. An addendum may be issued or updated on the website for new riskometer
(^) Fully or Party blocked against Interest Rate Swap (IRS) Hedging Position through Interest Rate Swaps as on 31 Jan 2023 is 4.70% of the net assets.
**Total Expense Ratio includes applicable B30 fee and GST
* For Fund Manager experience, please refer 'Our Fund Managers'
For last three IDCW, please refer 'Dividend History'.
For scheme performance, please refer 'Scheme Performances'