An open ended debt scheme investing in money market instruments
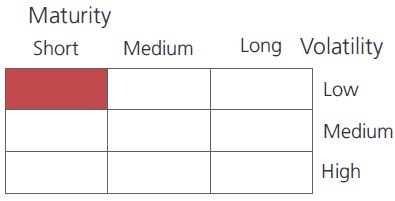
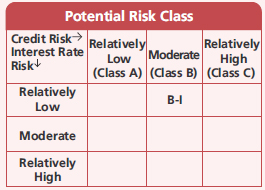
A relatively low interest rate risk and moderate credit risk
An open ended debt scheme investing in money market instruments
A relatively low interest rate risk and moderate credit risk
 |
 |
 
|
|
|
|
| Issuer/Instrument | Industry/ Rating |
% to Net Assets |
|---|---|---|
| Government Dated Securities | ||
| 7.16% Central Government | SOV | 0.37 |
| GS CG 15/06/2023 - (STRIPS) | SOV | 0.31 |
| GS CG 16/06/2023 - (STRIPS) | SOV | 0.27 |
| 8.39% Rajasthan State Govt-Rajasthan | SOV | 0.19 |
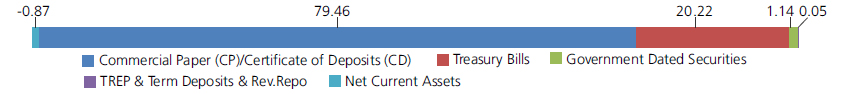
| Government Dated Securities - Total | 1.14 | |
| Money Market Instruments | ||
| Commercial Paper(CP)/Certificate of Deposits(CD) | ||
| Corporate Debt/Financial Institutions | ||
| HDFC Ltd. | CRISIL A1+ | 7.90 |
| HDFC Bank Ltd. | CARE A1+ | 7.43 |
| AXIS Bank Ltd. | CRISIL A1+ | 7.05 |
| Piramal Enterprises Ltd. | CRISIL A1+ | 3.11 |
| L & T Finance Ltd. | CRISIL A1+ | 2.90 |
| Can Fin Homes Ltd. | ICRA A1+ | 2.51 |
| Vedanta Ltd. | CRISIL A1+ | 2.40 |
| Panatone Finvest Ltd. | ICRA A1+ | 2.24 |
| HDFC Bank Ltd. | CRISIL A1+ | 2.13 |
| TATA MOTORS FINANCE LTD. | ICRA A1+ | 2.00 |
| Federal Bank Ltd. | CRISIL A1+ | 1.42 |
| Panatone Finvest Ltd. | CRISIL A1+ | 1.42 |
| Motilal Oswal Financial Services Limited | ICRA A1+ | 1.10 |
| AU Small Finance Bank Ltd. | FITCH IND A1+ | 0.74 |
| Bajaj Financial Securities Limited | CRISIL A1+ | 0.74 |
| Nuvama Wealth and Investment Ltd | CRISIL A1+ | 0.74 |
| Aditya Birla Finance Ltd. | ICRA A1+ | 0.73 |
| JM Financial Services Limited | CRISIL A1+ | 0.73 |
| Bahadur Chand Investments Private Limited | ICRA A1+ | 0.72 |
| Barclays Investments & Loan (India) Ltd. | CRISIL A1+ | 0.72 |
| Motilal Oswal Finvest Ltd. | CRISIL A1+ | 0.72 |
| JM Financial Products Limited | CRISIL A1+ | 0.70 |
| Nuvama Wealth Finance Limited | CRISIL A1+ | 0.56 |
| GODREJ INDUSTRIES LTD | CRISIL A1+ | 0.44 |
| Fed Bank Financial Services Limited | CRISIL A1+ | 0.37 |
| IIFL Wealth Management Ltd. | ICRA A1+ | 0.37 |
| Godrej Consumer Products Ltd. | CRISIL A1+ | 0.19 |
| Network18 Media & Investments Ltd. | CARE A1+ | 0.15 |
| Bharti Airtel Ltd. | CRISIL A1+ | 0.12 |
| LIC Housing Finance Ltd. | CRISIL A1+ | 0.12 |
| TV18 BROADCAST LTD | CARE A1+ | 0.04 |
| Corporate Debt/Financial Institutions - Total | 52.51 | |
| Public Sector Undertakings | ||
| Canara Bank | CRISIL A1+ | 9.73 |
| Bank Of Baroda | FITCH IND A1+ | 4.17 |
| National Bank for Agriculture & Rural Development | ICRA A1+ | 3.63 |
| Small Industries Development Bank Of India | CARE A1+ | 3.30 |
| Union Bank of India | FITCH IND A1+ | 2.77 |
| Small Industries Development Bank Of India | CRISIL A1+ | 1.85 |
| Bank Of Baroda | FITCH A1+(IND) | 0.74 |
| Union Bank of India | CRISIL A1+ | 0.69 |
| Export-Import Bank of India | CRISIL A1+ | 0.07 |
| Public Sector Undertakings - Total | 26.95 | |
| Treasury Bills | ||
| 182 Days Treasury Bill 09/03/2023 | SOV | 5.63 |
| 182 Days Treasury Bill 22/06/2023 | SOV | 4.72 |
| 182 Days Treasury Bill 01/06/2023 | SOV | 3.64 |
| 182 Days Treasury Bill 16/03/2023 | SOV | 3.33 |
| 182 Days Treasury Bill 15/06/2023 | SOV | 2.54 |
| 364 Days Treasury Bill 15/06/2023 | SOV | 0.36 |
| Treasury Bills - Total | 20.22 | |
| Triparty Repo | 0.05 | |
| Net Current Assets/(Liabilities) | -0.87 | |
| Grand Total | 100.00 | |

| Monthly SIP of (₹) 10000 | Since Inception | 10 years | 7 years | 5 years | 3 years | 1 year |
| Total amount invested (₹) | 23,50,000 | 12,00,000 | 8,40,000 | 6,00,000 | 3,60,000 | 1,20,000 |
| Total Value as on Jan 31, 2023 (₹) | 49,51,390 | 16,58,072 | 10,28,477 | 6,84,757 | 3,86,354 | 1,23,618 |
| Scheme Returns (%) | 7.07 | 6.29 | 5.69 | 5.22 | 4.64 | 5.62 |
| Nifty Money Market Index B-I Returns (%) | 7.13 | 6.04 | 5.38 | 4.93 | 4.53 | 5.75 |
| Alpha | -0.06 | 0.25 | 0.32 | 0.29 | 0.11 | -0.12 |
| Nifty Money Market Index B-I (₹)# | 49,85,041 | 16,36,566 | 10,16,898 | 6,79,754 | 3,85,700 | 1,23,697 |
| Nifty Money Market Index Returns (%) | 7.12 | 6.08 | 5.43 | 5.00 | 4.58 | 5.73 |
| Alpha | -0.05 | 0.21 | 0.26 | 0.23 | 0.06 | -0.11 |
| Nifty Money Market Index (₹)# | 49,80,155 | 16,39,670 | 10,18,929 | 6,80,835 | 3,86,000 | 1,23,686 |
| CRISIL 1 Year T-Bill Index (₹)^ | 44,31,796 | 16,19,339 | 10,14,509 | 6,79,186 | 3,83,777 | 1,23,386 |
| CRISIL 1 Year T-Bill Index Returns (%) | 6.07 | 5.84 | 5.31 | 4.90 | 4.20 | 5.26 |
Alpha is difference of scheme return with benchmark return.
| Growth Option | Rs3756.330 |
| Direct Growth Option | Rs3780.486 |
| Monthly-Reg-Plan-IDCW | Rs1053.873 |
| Monthly-Dir-Plan-IDCW | Rs1079.679 |
A) Regular Plan B) Direct Plan
Options: Payout of IDCW (w.e.f May 15,
2017, Under Monthly IDCW option only),
Reinvestment of IDCW & Growth
(applicable for all plans)
| Fund Manager* | Mr. Deepak Agrawal,
Mr. Manu Sharma &
Mr. Vihag Mishra
(Dedicated fund manager for investments in foreign securities) |
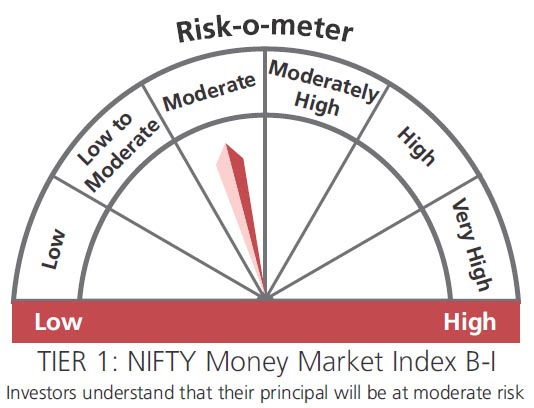
| Benchmark*** | Nifty Money Market Index B-I (Tier 1) Nifty Money Market Index (Tier 2) |
| Allotment date | July 14, 2003 |
| AAUM | Rs13,634.50 crs |
| AUM | Rs10,367.61 crs |
| Folio count | 13,370 |
Monthly (12th of every Month)
| Portfolio Average Maturity | 0.43 yrs |
| IRS Average Maturity* | - |
| Net Average Maturity | 0.43 yrs |
| Portfolio Modified Duration | 0.43 yrs |
| IRS Modified Duration* | - |
| Net Modified Duration | 0.43 yrs |
| Portfolio Macaulay Duration | 0.43 yrs |
| IRS Macaulay Duration* | - |
| Net Macaulay Duration | 0.43 yrs |
| Annualised YTM* | 7.48% |
| $Standard Deviation | 0.47% |
*in case of semi annual YTM, it will be annualized.
Initial Investment:Rs5000 Under growth,
weekly IDCW and monthly IDCW option & Rs1,00,000 under Daily Reinvestment of
IDCW option,
Additional Investment: Rs1000 & in multiples
of Rs1
Ideal Investment Horizon: 3-6 Months
Entry Load: Nil. (applicable for all plans)
Exit Load:
Nil. (applicable for all plans)
Regular: 0.36%; Direct: 0.26%
Fund
Benchmark
Benchmark
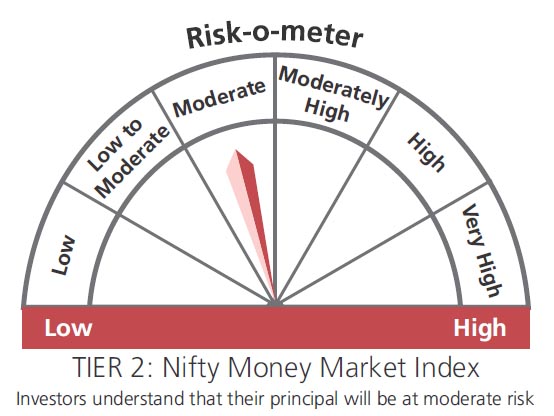
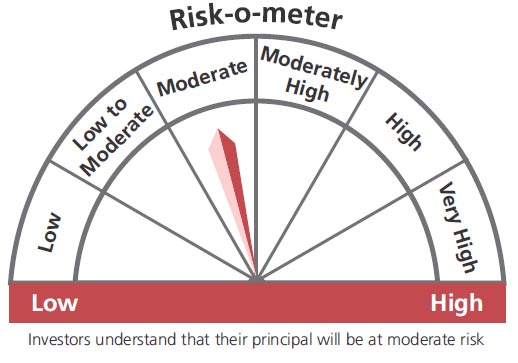
This product is suitable for investors who are seeking*:
- Income over a short term investment horizon
- Investment in money market securities
* Investors should consult their financial advisers if in doubt about whether the product is suitable for them.
The above risk-o—meter is based on the scheme portfolio as on 31st January 2023. An addendum may be issued or updated on the website for new riskometer
**Total Expense Ratio includes applicable B30 fee and GST
***As per SEBI circular no. SEBI/HO/IMD/IMD-11 DF3/P/CIR/2021 /652 dated October 27, 2021; AMFI letter no. 35P/MEM-COR/70/2021-22 dated November 25, 2021 and AMFI letter no. 35P/ MEM-COR/ 131 / 2021-22 dated March 31, 2022 with effect from April 01, 2022 ("Effective date"), the first tier benchmark index of the scheme. Existing benchmark will be Second Tier benchmark for aforementioned scheme.
* For Fund Manager experience, please refer 'Our Fund Managers'
For last three IDCW, please refer 'Dividend History'.
For scheme performance, please refer 'Scheme Performances'