| KOTAK TAX SAVER
An open-ended equity linked saving scheme with a statutory lock in of 3 years and tax benefits
An open-ended equity linked saving scheme with a statutory lock in of 3 years and tax benefits
| KOTAK TAX SAVER
An open-ended equity linked saving scheme with a statutory lock in of 3 years and tax benefits
An open-ended equity linked saving scheme with a statutory lock in of 3 years and tax benefits
 |
 |
 
|
|
|
|
Investment Objective
The investment objective of the scheme is
to generate long-term capital appreciation
from a diversified portfolio of equity and
equity related securities and enable
investors to avail the income tax rebate, as
permitted from time to time however, there
is no assurance that the objective of the
scheme will be realized.
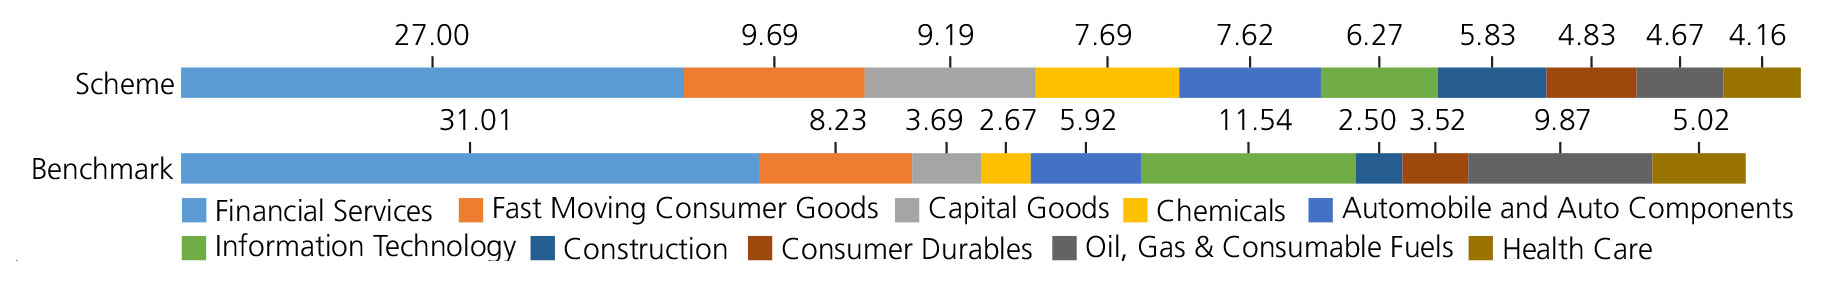
| Issuer/Instrument | Industry/ Rating |
% to Net Assets |
|---|---|---|
| Equity & Equity related | ||
| Banks | 22.80 | |
| ICICI Bank Ltd. | 6.88 | |
| State Bank Of India | 5.28 | |
| Axis Bank Ltd. | 4.99 | |
| HDFC Bank Ltd. | 2.30 | |
| Bank Of Baroda | 1.87 | |
| AU Small Finance Bank Ltd. | 1.48 | |
| Chemicals and Petrochemicals | 6.56 | |
| SRF Ltd. | 2.50 | |
| Linde India Ltd. | 2.11 | |
| Solar Industries India Limited | 0.96 | |
| Archean Chemicals Ltd. | 0.53 | |
| Tata Chemicals Ltd | 0.46 | |
| IT - Software | 6.27 | |
| Infosys Ltd. | 3.90 | |
| Tata Consultancy Services Ltd. | 2.37 | |
| Construction | 5.84 | |
| Larsen And Toubro Ltd. | 4.06 | |
| Kalpataru Power Transmission Ltd. | 1.38 | |
| Ashoka Buildcon Limited | 0.40 | |
| Diversified FMCG | 5.73 | |
| ITC Ltd. | 3.48 | |
| Hindustan Unilever Ltd. | 2.25 | |
| Automobiles | 5.51 | |
| Maruti Suzuki India Limited | 3.54 | |
| Mahindra & Mahindra Ltd. | 1.97 | |
| Industrial Products | 5.18 | |
| Cummins India Ltd. | 1.94 | |
| Bharat Forge Ltd. | 1.11 | |
| Carborundum Universal Ltd. | 1.08 | |
| SKF India Ltd | 1.05 | |
| Consumer Durables | 4.82 | |
| Whirlpool of India Ltd. | 1.19 | |
| Blue Star Ltd. | 1.00 | |
| Kansai Nerolac Paints Ltd | 0.94 | |
| V-Guard Industries Ltd. | 0.67 | |
| Sheela Foam Ltd | 0.56 | |
| Hawkins Cooker Ltd | 0.38 | |
| Orient Electric Ltd. | 0.08 | |
| Pharmaceuticals and Biotechnology | 4.15 | |
| Sun Pharmaceuticals Industries Ltd. | 2.30 | |
| Cipla Ltd. | 0.97 | |
| Zydus Lifesciences Limited | 0.88 | |
| Petroleum Products | 3.74 | |
| RELIANCE INDUSTRIES LTD. | 3.74 | |
| Cement and Cement Products | 3.32 | |
| Ambuja Cements Ltd. | 1.85 | |
| Ultratech Cement Ltd. | 1.47 | |
| Electrical Equipment | 3.05 | |
| ABB India Ltd | 1.67 | |
| Thermax Ltd. | 1.38 | |
| Ferrous Metals | 2.51 | |
| Jindal Steel & Power Ltd. | 2.51 | |
| Finance | 2.42 | |
| Bajaj Finance Ltd. | 1.78 | |
| Bajaj Finserv Ltd. | 0.64 | |
| Auto Components | 2.10 | |
| Exide Industries Ltd | 1.15 | |
| Balkrishna Industries Ltd. | 0.95 | |
| Telecom - Services | 1.79 | |
| Bharti Airtel Ltd | 1.75 | |
| Bharti Airtel Ltd - Partly Paid Shares | 0.04 | |
| Beverages | 1.77 | |
| United Spirits Ltd. | 1.77 | |
| Transport Services | 1.50 | |
| Blue Dart Express Ltd. | 0.80 | |
| Container Corporation of India Ltd. | 0.70 | |
| Insurance | 1.36 | |
| SBI Life Insurance Company Ltd | 1.36 | |
| Power | 1.20 | |
| National Thermal Power Corporation Limited | 1.20 | |
| Food Products | 1.17 | |
| Britannia Industries Ltd. | 1.17 | |
| Fertilizers and Agrochemicals | 1.13 | |
| Coromandel International Ltd. | 1.13 | |
| Agricultural Food and other Product | 1.02 | |
| Balrampur Chini Mills Ltd. | 1.02 | |
| Agricultural, Commercial and Constr | 0.95 | |
| Ashok Leyland Ltd. | 0.95 | |
| Gas | 0.92 | |
| Gujarat State Petronet Ltd. | 0.92 | |
| Non - Ferrous Metals | 0.89 | |
| Hindalco Industries Ltd | 0.89 | |
| Capital Markets | 0.43 | |
| Prudent Corporate Advisory Services Ltd. | 0.43 | |
| Equity & Equity related - Total | 98.13 | |
| Triparty Repo | 2.01 | |
| Net Current Assets/(Liabilities) | -0.14 | |
| Grand Total | 100.00 | |
| Monthly SIP of (₹) 10000 | Since Inception | 10 years | 7 years | 5 years | 3 years | 1 year |
| Total amount invested (₹) | 20,70,000 | 12,00,000 | 8,40,000 | 6,00,000 | 3,60,000 | 1,20,000 |
| Total Value as on Jan 31, 2023(₹) | 69,43,811 | 25,59,383 | 13,98,879 | 8,87,210 | 4,67,987 | 1,23,734 |
| Scheme Returns (%) | 12.72 | 14.48 | 14.31 | 15.63 | 17.79 | 5.80 |
| Nifty 500 (TRI) Returns (%) | 12.41 | 13.47 | 13.67 | 14.45 | 16.78 | 2.24 |
| Alpha | 0.31 | 1.02 | 0.64 | 1.18 | 1.00 | 3.56 |
| Nifty 500 (TRI) (₹)# | 67,27,007 | 24,23,595 | 13,67,403 | 8,61,799 | 4,61,396 | 1,21,449 |
| Nifty 50 (TRI) (₹)^ | 65,59,685 | 23,77,776 | 13,75,036 | 8,57,687 | 4,58,693 | 1,23,148 |
| Nifty 50 (TRI) Returns (%) | 12.16 | 13.11 | 13.83 | 14.26 | 16.37 | 4.88 |
Scheme Inception : - November 23, 2005. The returns are calculated by XIRR approach assuming investment of Rs10,000/- on the 1st working day of every month. XIRR helps in calculating return on investments given an initial and final value and a series of
cash inflows and outflows and taking the time of investment into consideration. Since inception returns are assumed to be starting from the beginning of the subsequent month from the date of inception. # Benchmark ; ^ Additional Benchmark. TRI – Total
Return Index, In terms of SEBI circular dated January 4, 2018, the performance of the scheme is benchmarked to the Total Return variant (TRI) of the Benchmark Index instead of Price Return Variant (PRI).
Alpha is difference of scheme return with benchmark return. *All payouts during the period have been reinvested in the units of the scheme at the then prevailing NAV. Source: ICRA MFI Explorer.
NAV
| Reg-Plan-IDCW | Rs27.806 |
| Dir-Plan-IDCW | Rs35.393 |
| Growth option | Rs74.300 |
| Direct Growth option | Rs84.491 |
Available Plans/Options
A) Regular Plan B) Direct Plan
Options: Growth and IDCW (Payout)
(applicable for all plans)
| Fund Manager* | Mr. Harsha Upadhyaya |
| Benchmark | Nifty 500 TRI |
| Allotment date | November 23, 2005 |
| AAUM | Rs3,169.17 crs |
| AUM | Rs3,143.14 crs |
| Folio count | 3,77,938 |
IDCW Frequency
Trustee's Discretion
Ratios
| Portfolio Turnover | 14.68% |
| $Beta | 0.92 |
| $Sharpe ## | 0.48 |
| $Standard Deviation | 21.43% |
| (P/E) | 22.33 |
| P/BV | 3.25 |
| IDCW Yield | 1.00 |
Minimum Investment Amount
Initial Investment:
Rs500 and in multiple of
Rs500
Additional Investment: Rs500 & in
multiples of Rs500
Ideal Investments Horizon: 5 years & above
Load Structure
Entry Load: Nil. (applicable for all plans)
Exit Load: Nil. (applicable for all plans)
Total Expense Ratio**
Regular: 2.08%; Direct: 0.68%
Data as on January 31, 2023
Fund
Benchmark
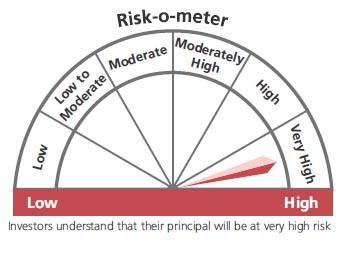
This product is suitable for investors who are seeking*:
Benchmark
This product is suitable for investors who are seeking*:
- long term capital growth with a 3 year lock in
- Investment in portfolio of predominantly equity & equity related securities.
* Investors should consult their financial advisers if in doubt about whether the product is suitable for them.
The above risk-o—meter is based on the scheme portfolio as on 31st January 2023. An addendum may be issued or updated on the website for new riskometer
## Risk rate assumed to be 6.50% (FBIL Overnight MIBOR rate as on 31st January 2023).**Total Expense Ratio includes applicable B30 fee and GST.
* For Fund Manager experience, please refer 'Our Fund Managers'
For last three IDCW, please refer 'Dividend History'.
For scheme performance, please refer 'Scheme Performances'