An open ended equity scheme investing in the Banking and Financial Services sectors
An open ended equity scheme investing in the Banking and Financial Services sectors
 |
 |
 
|
|
|
|
The investment objective of the scheme is to generate long-term capital appreciation from a portfolio that is invested predominantly in equity and equity related securities of companies engaged in banking and financial services sector. However, there is no assurance that the objective of the scheme will be achieved.
The investment objective of the scheme is to generate long-term capital appreciation from a portfolio that is invested predominantly in equity and equity related securities of companies engaged in banking and financial services sector. However, there is no assurance that the objective of the scheme will be achieved.
| Issuer/Instrument | |
% to Net Assets |
|---|---|---|
| Equity & Equity related |
||
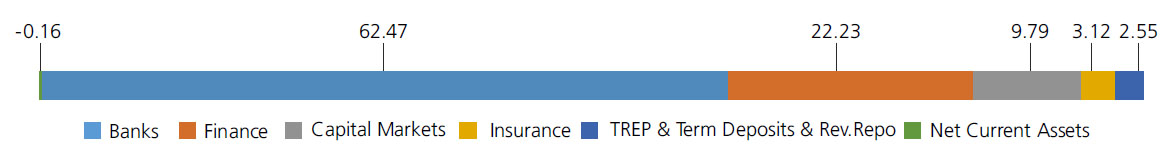
| Banks | 62.47 | |
| HDFC Bank Ltd. | 17.70 | |
| ICICI Bank Ltd. | 17.70 | |
| State Bank Of India | 7.56 | |
| Axis Bank Ltd. | 6.72 | |
| Kotak Mahindra Bank Ltd. | 4.69 | |
| INDIAN BANK | 1.98 | |
| City Union Bank Ltd. | 1.55 | |
| KARUR VYSYA BANK LTD. | 1.23 | |
| Bank Of Baroda | 1.16 | |
| FEDERAL BANK LTD. | 0.98 | |
| SOUTH INDIAN BANK LTD. | 0.77 | |
| IndusInd Bank Ltd. | 0.43 | |
| Finance | 22.23 | |
| Bajaj Finance Ltd. | 5.75 | |
| Power Finance Corporation Ltd. | 4.22 | |
| SHRIRAM FINANCE LTD. | 3.02 | |
| POONAWALLA FINCORP LTD. | 1.96 | |
| INDIA SHELTER FINANCE CORPORATION LTD | 1.79 | |
| LIC Housing Finance Ltd. | 1.53 | |
| Cholamandalam Investment and Finance Company Ltd. | 1.35 | |
| CAN FIN HOMES LTD | 1.14 | |
| BAJAJ HOUSING FINANCE LTD. | 0.96 | |
| Mahindra & Mahindra Financial Services Ltd. | 0.51 | |
| Capital Markets | 9.79 | |
| 360 ONE WAM LTD. | 1.90 | |
| Aditya Birla Sun Life AMC Ltd | 1.68 | |
| Nippon Life India Asset Management Ltd. | 1.65 | |
| NUVAMA WEALTH MANAGEMENT LIMITED | 1.64 | |
| DAM CAPITAL ADVISORS LIMITED | 1.42 | |
| BSE LTD. | 0.81 | |
| ICICI Securities Ltd | 0.69 | |
| Insurance | 3.12 | |
| ICICI Lombard General Insurance Company Ltd | 2.42 | |
| HDFC Life Insurance Company Ltd. | 0.70 | |
| Equity & Equity related - Total | 97.61 | |
| Triparty Repo | 2.55 | |
| Net Current Assets/(Liabilities) | -0.16 | |
| Grand Total | 100.00 | |
| | ||
| Monthly SIP of (Rs) 10000 | Since Inception | 1 year |
| Total amount invested (₹) | 2,40,000 | 1,20,000 |
| Total Value as on Jan 31, 2025 (₹) | 2,65,510 | 1,18,638 |
| Scheme Returns (%) | 10.05 | -2.09 |
| Nifty Financial Services Index TRI Returns (%) | 11.27 | 4.91 |
| Alpha* | -1.22 | -7.00 |
| Nifty Financial Services Index TRI (₹)# | 2,68,679 | 1,23,165 |
| Nifty 50 (TRI) (₹)^ | 2,71,906 | 1,20,014 |
| Nifty 50 (TRI) Returns (%) | 12.51 | 0.02 |
| Regular | Direct | |
| Growth | Rs13.5782 | Rs14.0077 |
| IDCW | Rs13.5783 | Rs14.0068 |
A) Regular Plan B) Direct Plan
Options: Growth and Income Distribution cum capital withdrawal (IDCW) (Payout and Reinvestment)
| Fund Manager* | Ms. Shibani Sircar
Kurian & Mr. Abhishek Bisen |
| Benchmark | Nifty Financial Services Index TRI |
| Allotment date | February 27, 2023 |
| AAUM | Rs1,012.02 crs |
| AUM | Rs1,027.25 crs |
| Folio count | 58,154 |
Trustee's Discretion
| Portfolio Turnover | 29.47% |
| $Beta | 0.94 |
| $Sharpe ## | 0.86 |
| $Standard Deviation | 11.98% |
| ^^(P/E) | 14.65 |
| ^^P/BV | 2.33 |
Initial & Additional Investment
• Rs100 and any amount thereafter
Systematic Investment Plan (SIP)
• Rs 100 and any amount thereafter
• 5 years & above
Entry Load: Nil. (applicable for all plans)
Exit Load:
• For redemption / switch out within 30
days from the date of allotment: 0.5%
• If units are redeemed or switched out on
or after 30 days from the date of allotment:
NIL
| Regular Plan: | 2.19% |
| Direct Plan: | 0.70% |
Folio Count data as on 31st December 2024.
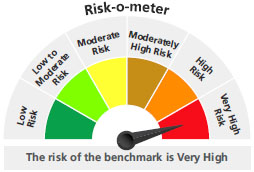
Benchmark : Nifty Financial Services Index TRI
This product is suitable for investors who are seeking*:
- Long term capital growth
- Investment in portfolio of predominantly equity & equity related securities of companies engaged in Banking & Financial Services
* Investors should consult their financial advisors if in doubt about whether the product is suitable for them.
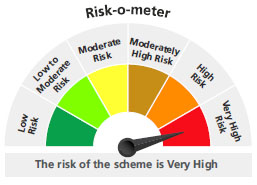
The above risk-o—meter is based on the scheme portfolio as on 31st December, 2024. An addendum may be issued or updated on the website for new riskometer.
* For Fund Manager experience, please refer 'For Regular Plan' & 'For Direct Plan'
For scheme performance, please refer 'For Regular Plan' & 'For Direct Plan'