An open-ended scheme replicating/tracking the Nifty Midcap 150 Momentum 50 Index
An open-ended scheme replicating/tracking the Nifty Midcap 150 Momentum 50 Index
 |
 |
 
|
|
|
|
| Issuer/Instrument | |
% to Net Assets |
|---|---|---|
| Equity & Equity Related | ||
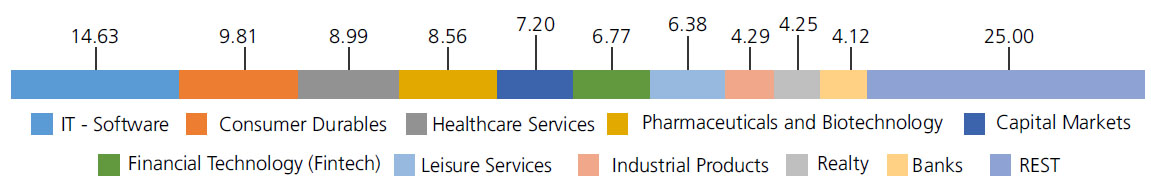
| IT - Software | 14.63 | |
| PERSISTENT SYSTEMS LIMITED | 5.27 | |
| Coforge Limited | 4.86 | |
| Oracle Financial Services Software Ltd | 2.65 | |
| Mphasis Ltd | 1.85 | |
| Consumer Durables | 9.81 | |
| Dixon Technologies India Ltd. | 4.64 | |
| KALYAN JEWELLERS INDIA LTD. | 2.62 | |
| Voltas Ltd. | 2.55 | |
| Healthcare Services | 8.99 | |
| MAX HEALTHCARE INSTITUTE LTD. | 4.83 | |
| Fortis Healthcare India Ltd | 3.10 | |
| Syngene International Limited | 1.06 | |
| Pharmaceuticals and Biotechnology | 8.56 | |
| Lupin Ltd. | 4.32 | |
| Ipca Laboratories Ltd. | 1.42 | |
| Aurobindo Pharma Ltd. | 1.15 | |
| Biocon Ltd. | 0.88 | |
| Ajanta Pharma Ltd. | 0.79 | |
| Capital Markets | 7.20 | |
| BSE LTD. | 5.44 | |
| HDFC Asset Management Company Ltd. | 1.76 | |
| Financial Technology (Fintech) | 6.77 | |
| PB FINTECH LTD. | 4.73 | |
| ONE 97 COMMUNICATIONS LTD. | 2.04 | |
| Leisure Services | 6.38 | |
| INDIAN HOTELS COMPANY LTD. | 4.92 | |
| Jubilant Foodworks Limited | 1.46 | |
| Industrial Products | 4.29 | |
| Cummins India Ltd. | 2.13 | |
| Polycab India Ltd. | 1.15 | |
| KEI INDUSTRIES LTD. | 1.01 | |
| Realty | 4.25 | |
| GODREJ PROPERTIES LIMITED | 1.25 | |
| PHOENIX MILLS LTD. | 1.11 | |
| Oberoi Realty Ltd | 0.98 | |
| PRESTIGE ESTATES PROJECTS LIMITED | 0.91 | |
| Banks | 4.12 | |
| FEDERAL BANK LTD. | 3.41 | |
| INDIAN BANK | 0.71 | |
| Electrical Equipment | 3.96 | |
| CG POWER AND INDUSTRIAL SOLUTIONS LIMITED | 2.32 | |
| HITACHI ENERGY INDIA LIMITED | 1.01 | |
| Thermax Ltd. | 0.63 | |
| Finance | 2.52 | |
| INDIAN RENEWABLE ENERGY DEVELOPMENT AGENCY LTD. | 1.06 | |
| CRISIL Ltd. | 0.80 | |
| HOUSING & URBAN DEVELOPMENT CORPORATION LTD. | 0.66 | |
| Telecom - Services | 2.25 | |
| Indus Towers Ltd. | 2.25 | |
| Construction | 1.84 | |
| Rail Vikas Nigam Limited. | 1.84 | |
| Fertilizers and Agrochemicals | 1.82 | |
| Coromandel International Ltd. | 1.82 | |
| Oil | 1.70 | |
| OIL INDIA LIMITED | 1.70 | |
| Textiles and Apparels | 1.60 | |
| Page Industries Ltd | 1.60 | |
| Petroleum Products | 1.55 | |
| HINDUSTAN PETROLEUM CORPORATION LTD | 1.55 | |
| Ferrous Metals | 1.47 | |
| LLOYDS METALS AND ENERGY LTD. | 1.47 | |
| Gas | 1.42 | |
| Petronet LNG Ltd. | 1.42 | |
| Chemicals and Petrochemicals | 1.33 | |
| SOLAR INDUSTRIES INDIA LIMITED | 1.33 | |
| Industrial Manufacturing | 1.10 | |
| MAZAGOAN DOCK SHIPBUILDERS LTD | 1.10 | |
| Power | 1.06 | |
| TORRENT POWER LTD | 1.06 | |
| Auto Components | 1.00 | |
| UNO MINDA LIMITED | 1.00 | |
| Diversified | 0.44 | |
| Godrej Industries Ltd. | 0.44 | |
| Aerospace and Defense | 0.42 | |
| BHARAT DYNAMICS LTD | 0.42 | |
| Equity & Equity related - Total | 100.48 | |
| Triparty Repo | 0.55 | |
| Net Current Assets/(Liabilities) | -1.03 | |
| Grand Total | 100.00 | |
| Regular | Direct | |
| Growth | Rs8.6357 | Rs8.6536 |
| IDCW | Rs8.6357 | Rs8.6535 |
A) Regular Plan B) Direct Plan
OOptions: a) Growth and Income
Distribution cum capital withdrawal
(IDCW) (Payout and Reinvestment)
| Fund Manager* | Mr. Devender Singhal, Mr. Satish Dondapati & Mr. Abhishek Bisen |
| Benchmark | Nifty Midcap 150 Momentum 50 Index (TRI) |
| Allotment date | October 8, 2024 |
| AAUM | Rs70.25 crs |
| AUM | Rs72.86 crs |
| Folio count | 25,658 |
| Portfolio Turnover | 53.09% |
| Tracking Error | 0.61% |
Initial & Additional Investment
• Rs100 and any amount thereafter
Systematic Investment Plan (SIP)
• Rs 100 and any amount thereafter
• 5 years & above
IDCW is declared subject to availability and adequacy of distributable surplus
Entry Load:
NIL. (applicable for all plans)
Exit Load:
NIL
| Regular Plan: | 0.93% |
| Direct Plan: | 0.28% |
Folio Count data as on 31st December 2024.
Fund
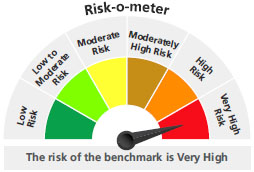
Benchmark : Nifty Midcap 150 Momentum 50 Index (TRI)
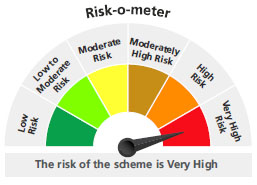
This product is suitable for investors who are seeking*:
- Long term capital growth
- Return that corresponds to the performance of Nifty Midcap 150 Momentum 50 Index subject to tracking error.
* Investors should consult their financial advisors if in doubt about whether the product is suitable for them.
The above risk-o—meter is based on the scheme portfolio as on 31st December, 2024. An addendum may be issued or updated on the website for new riskometer.
**Total Expense Ratio includes applicable B30 fee and GST.
The scheme has not completed 6 month since inception
* For Fund Manager experience, please refer 'For Regular Plan' & 'For Direct Plan'