 
|
|
|
Key Events for the Month of January 2026
• India's Services Purchasing Managers' Index (PMI) fell to 58.0 in December from 59.8 in November. Despite
the decline, the reading remained above the 50-mark, indicating continued expansion in activity (a reading below 50
signifies contraction). The headline index has remained in expansionary territory for the 53rd consecutive month.
• India's Manufacturing Purchasing Managers' Index (PMI) eased to 55.0 in December, marking a 38-month
low. However, the index stayed well above the 50-mark, which separates growth from contraction.
• India's Consumer Price Inflation (CPI) rose to 1.33% in December, from a series low of 0.25% in October and
0.71% in November, largely due to a narrowing of food deflation and the waning of a favourable base effect.
• India's Wholesale Price Index (WPI) extended its upward momentum for the second consecutive month,
registering 0.83% in December 2025, driven by higher prices of food, non-food articles, and manufactured items on
a month-on-month basis.
• India's gross GST collections rose 6.2% year-on-year to ₹1.93 lakh crore, rise driven by firm domestic demand
and strong import activity.
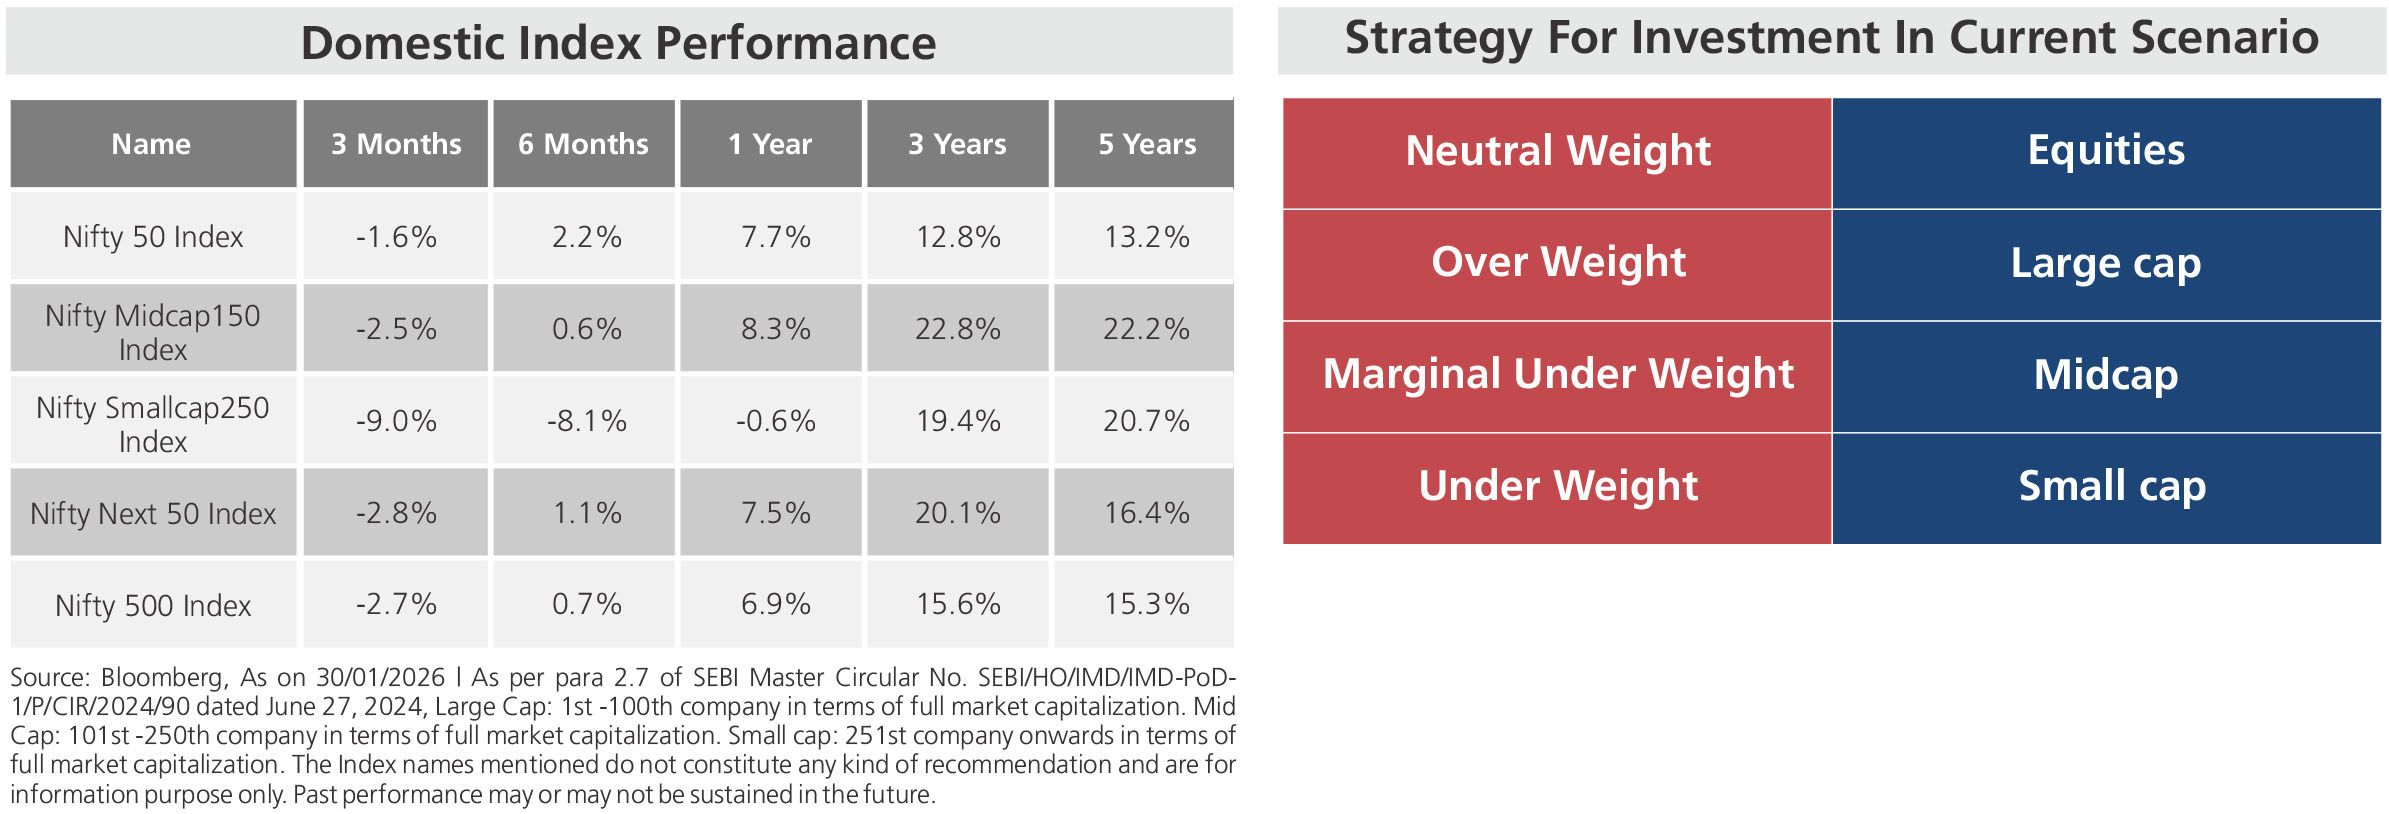
• The month ended on a negative note for Indian equity markets, with the Nifty 50 declining 3.10% and the BSE
Sensex falling 3.46%.
| |
Sectoral Index Performance |
| Name | 3 Months | 6 Months | 1 Year | 3 Years | 5 Years |
| Nifty Auto Index | -0.2% | 13.1% | 17.0% | 26.2% | 22.2% |
| Nifty Bank Index | 3.2% | 6.5% | 20.2% | 13.6% | 14.3% |
| Nifty Energy Index | -3.1% | 0.1% | 3.7% | 14.0% | 16.8% |
| Nifty Financial Services Index | 0.7% | 2.6% | 17.7% | 14.7% | 13.4% |
| Nifty FMCG Index | -8.9% | -8.2% | -9.7% | 4.8% | 9.1% |
| Nifty Healthcare Index | -5.4% | -6.6% | 0.8% | 21.0% | 20.0% |
| Nifty Infrastructure Index | -4.3% | 1.0% | 9.6% | 21.8% | 20.0% |
| Nifty IT Index | 6.5% | 7.7% | -10.8% | 8.5% | 9.1% |
| Nifty Media Index | -10.0% | -14.8% | -12.3% | -10.0% | -3.4% |
| Nifty Metal Index | 11.5% | 27.4% | 40.8% | 22.3% | 30.9% |
| Nifty Pharma Index | -2.1% | -4.6% | 1.3% | 20.7% | 12.3% |
| Nifty PSU Bank Index | 10.2% | 31.7% | 42.8% | 31.1% | 37.8% |
| Nifty Realty Index | -17.4% | -14.2% | -15.0% | 23.9% | 20.7% |
| BSE Consumer Durables Index | -8.6% | -7.0% | -4.4% | 13.6% | 12.9% |
| BSE Industrial Index | -5.7% | -1.6% | 4.0% | 27.3% | 31.8% |
Past performance may or may not be sustained in the future.
| |
Global Index Performance |
| Name | 3 Months | 6 Months | 1 Year | 3 Years | 5 Years |
| MSCI World Index | 3.1% | 11.1% | 18.0% | 17.6% | 11.2% |
| MSCI Emerging Index | 9.0% | 22.9% | 39.8% | 14.0% | 2.8% |
| MSCI India index | -1.4% | 2.2% | 7.7% | 14.6% | 13.8% |
| Dow Jones Industrial Average Index | 2.8% | 10.8% | 9.8% | 12.8% | 10.3% |
| Nasdaq Composite Index | -1.1% | 11.1% | 19.5% | 26.5% | 12.4% |
| Nikkei 225 Index | 1.7% | 29.8% | 34.7% | 25.0% | 14.0% |
| Shanghai Composite Index | 4.1% | 15.2% | 26.7% | 8.1% | 3.4% |
| Deutsche Boerse AG german Stock Index DAX | 2.4% | 2.0% | 12.9% | 17.5% | 12.8% |
Past performance may or may not be sustained in the future.