| KOTAK BANKING AND PSU DEBT FUND
An open ended debt scheme predominantly investing in Debt instruments of banks, Public Sector Undertakings, Public Financial Institutions and Municipal Bonds.
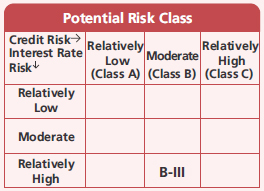
A relatively high interest rate risk and moderate credit risk.
An open ended debt scheme predominantly investing in Debt instruments of banks, Public Sector Undertakings, Public Financial Institutions and Municipal Bonds.
A relatively high interest rate risk and moderate credit risk.
| KOTAK BANKING AND PSU DEBT FUND
An open ended debt scheme predominantly investing in Debt instruments of banks, Public Sector Undertakings, Public Financial Institutions and Municipal Bonds.
A relatively high interest rate risk and moderate credit risk.
An open ended debt scheme predominantly investing in Debt instruments of banks, Public Sector Undertakings, Public Financial Institutions and Municipal Bonds.
A relatively high interest rate risk and moderate credit risk.
 |
 |
 
|
|
|
|
Investment Objective
To generate income by predominantly investing in debt & money market securities issued by Banks, Public Sector
Undertaking (PSUs), Public Financial Institutions (PFI), Municipal Bonds and Reverse repos in such securities, sovereign securities issued by the
Central Government and State Governments, and / or any security unconditionally guaranteed by the Govt. of India. There is no assurance
that or guarantee that the investment objective of the scheme will be achieved.
| Issuer/Instrument | Rating | % to Net Assets |
|---|---|---|
| Debt Instruments | ||
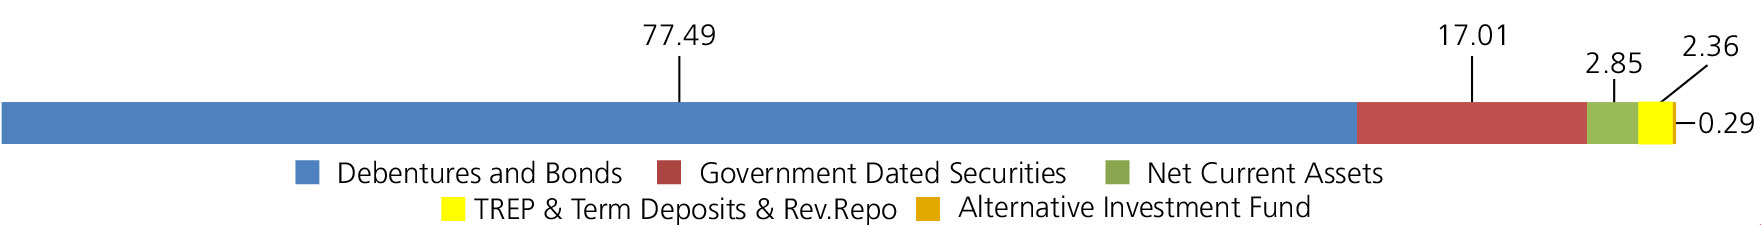
| Debentures and Bonds | ||
| Government Dated Securities | ||
| 7.18% Central Government(^) | SOV | 6.88 |
| 6.99% Central Government(^) | SOV | 2.22 |
| 7.09% Central Government(^) | SOV | 2.10 |
| 6.63% Central Government(^) | SOV | 1.71 |
| 7.81% Central Government(^) | SOV | 1.29 |
| 7.10% Central Government(^) | SOV | 0.78 |
| 7.63% Maharashtra State Govt-Maharashtra | SOV | 0.68 |
| 6.90% Central Government(^) | SOV | 0.65 |
| 7.42% Gujarat State Govt-Gujarat | SOV | 0.52 |
| 7.30% Central Government(^) | SOV | 0.17 |
| 6.46% Gujarat State Govt-Gujarat | SOV | 0.01 |
| Government Dated Securities - Total | 17.01 | |
| Public Sector Undertakings | ||
| SMALL INDUSTRIES DEVELOPMENT BANK OF INDIA | CRISIL AAA | 9.49 |
| REC LTD | CRISIL AAA | 7.82 |
| Power Finance Corporation Ltd. | CRISIL AAA | 7.43 |
| DME DEVELOPMENT LIMITED (^) | CRISIL AAA | 5.31 |
| Power Grid Corporation of India Ltd.(^) | CRISIL AAA | 4.41 |
| National Housing Bank (^) | CARE AAA | 3.75 |
| INDIAN OIL CORPORATION LTD. (^) | CRISIL AAA | 3.26 |
| NATIONAL BANK FOR AGRICULTURE & RURAL DEVELOPMENT | CRISIL AAA | 3.25 |
| NATIONAL BANK FOR AGRICULTURE & RURAL DEVELOPMENT | ICRA AAA | 2.50 |
| STATE BANK OF INDIA.(Basel III TIER II Bonds)(^) | CRISIL AAA | 2.38 |
| Power Finance Corporation Ltd. (^) | CRISIL AAA | 1.73 |
| INDIAN RAILWAY FINANCE CORPORATION LTD. | CRISIL AAA | 1.72 |
| Export-Import Bank of India(^) | CRISIL AAA | 1.71 |
| NATIONAL BANK FOR FINANCING INFRASTRUCTURE AND DEVELOPMENT | CRISIL AAA | 1.66 |
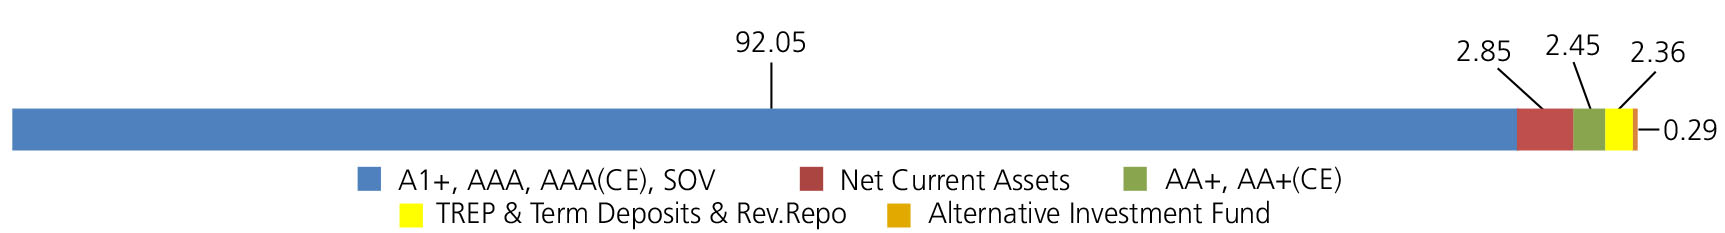
| UNION BANK OF INDIA (Basel III TIER I Bonds) | CARE AA+ | 1.64 |
| National Housing Bank | CRISIL AAA | 1.35 |
| Food Corporation of India | CRISIL AAA(CE) | 1.30 |
| NUCLEAR POWER CORPORATION OF INDIA LTD. | ICRA AAA | 1.29 |
| NATIONAL BANK FOR AGRICULTURE & RURAL DEVELOPMENT | FITCH AAA | 1.28 |
| Food Corporation of India (^) | CRISIL AAA(CE) | 0.86 |
| Mahanagar Telephone Nigam Ltd. | BRICKWORK AA+(CE) | 0.81 |
| REC LTD | ICRA AAA | 0.42 |
| Mahanagar Telephone Nigam Ltd. | CARE AAA(CE) | 0.08 |
| Public Sector Undertakings - Total | 65.45 | |
| Corporate Debt/Financial Institutions | ||
| HDFC BANK LTD. (^) | CRISIL AAA | 5.20 |
| HDFC BANK LTD.(^) | CRISIL AAA | 4.70 |
| LIC HOUSING FINANCE LTD. | CRISIL AAA | 2.14 |
| Corporate Debt/Financial Institutions - Total | 12.04 | |
| Triparty Repo | 2.36 | |
| Alternative Investment Fund | ||
| CORPORATE DEBT MARKET DEVELOPMENT FUND - CLASS A2 | Alternative Investment Fund | 0.29 |
| Alternative Investment Fund - Total | 0.29 | |
| Net Current Assets/(Liabilities) | 2.85 | |
| Grand Total | 100.00 | |
| Monthly SIP of (₹) 10000 | Since Inception | 10 years | 7 years | 5 years | 3 years | 1 year |
| Total amount invested (₹) | 32,00,000 | 12,00,000 | 8,40,000 | 6,00,000 | 3,60,000 | 1,20,000 |
| Total Value as on July 31, 2025 (₹) | 93,55,332 | 17,41,526 | 10,80,613 | 7,16,567 | 4,07,021 | 1,25,568 |
| Scheme Returns (%) | 7.22 | 7.24 | 7.09 | 7.04 | 8.15 | 8.77 |
| CRISIL Banking & PSU Debt A-II Index Returns (%) | NA | 7.06 | 6.87 | 6.83 | 7.87 | 8.52 |
| Alpha* | NA | 0.18 | 0.21 | 0.21 | 0.28 | 0.26 |
| CRISIL Banking & PSU Debt A-II Index (₹)# | NA | 17,25,574 | 10,72,456 | 7,12,844 | 4,05,339 | 1,25,407 |
| CRISIL 10 Year Gilt Index (₹)^ | NA | 16,87,487 | 10,71,344 | 7,20,568 | 4,13,590 | 1,25,796 |
| CRISIL 10 Year Gilt Index (%) | NA | 6.63 | 6.84 | 7.26 | 9.23 | 9.14 |
Scheme Inception : - December 29, 1998. The returns are calculated by XIRR approach assuming investment of ₹ 10,000/- on the 1st working day of every month. Since Inception returns are
assumed to be starting from the inception date of the Scheme and calculated accordingly. XIRR helps in calculating return on investments given an initial and final value and a series of cash inflows
and outflows and taking the time of investment into consideration. The SIP performance details provided herein are of Regular Plan - Growth Option Different plans have different expense structure. # Benchmark; ^ Additional Benchmark. Alpha is difference of scheme return with benchmark return. *All
payouts during the period have been reinvested in the units of the scheme at the then prevailing NAV. Source: ICRA MFI Explorer.
Net Asset Value (NAV)
| Regular | Direct | |
| Growth | Rs65.9785 | Rs68.7639 |
| Monthly Dividend | Rs12.3958 | Rs10.2717 |
Available Plans/Options
A) Regular Plan B) Direct Plan
Options: Payout of IDCW, Reinvestment of
IDCW & Growth (applicable for all plans)
| Fund Manager* | Mr. Deepak Agrawal, Mr. Abhishek Bisen (upto May 31, 2025) & Mr. Dharmesh Thakar (w.e.f. June 01, 2025) |
| Benchmark | CRISIL Banking & PSU Debt A-II Index |
| Allotment date | December 29,1998 |
| AAUM | Rs6,017.05 crs |
| AUM | Rs5,983.06 crs |
| Folio count | 14,914 |
IDCW Frequency
Monthly (12th of every Month)
Debt Quant & Ratios
| Average Maturity | 5.49 yrs |
| Modified Duration | 3.43 yrs |
| Macaulay Duration | 3.64 yrs |
| Annualised YTM* | 6.82% |
| $Standard Deviation | 1.51% |
Source: $ICRA MFI Explorer.
Minimum Investment Amount
Initial & Additional Investment
• Rs100 and any amount thereafter
Systematic Investment Plan (SIP)
• Rs 100 and any amount thereafter
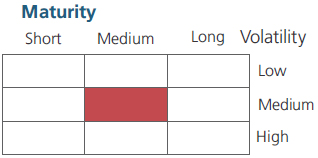
Ideal Investments Horizon
• 2-3 years
Load Structure
Entry Load:
Nil. (applicable for all plans)
Exit Load:
Nil. (applicable for all plans)
Total Expense Ratio**
| Regular Plan: | 0.75% |
| Direct Plan: | 0.40% |
Data as on 31st July, 2025 unless
otherwise specified.
Folio Count data as on 30th June 2025.
Folio Count data as on 30th June 2025.
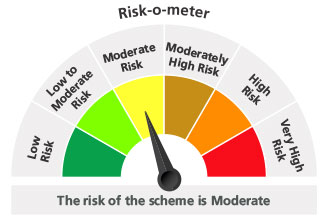
Fund
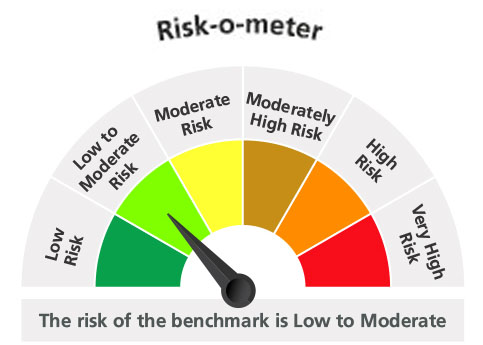
Benchmark: CRISIL Banking & PSU Debt A-II Index
This product is suitable for investors who are seeking*:
- Income over a short to medium term investment horizon.
- Investment in debt & money market securities of PSUs , Banks , Public Finanacial Institutions, government securities, and Municipal Bonds.
* Investors should consult their financial advisors if in doubt about whether the product is suitable for them.
For latest Riskometer, investors may refer to an addendum issued or updated on website at www.kotakmf.com
(^)This scheme has exposure to floating rate instruments and / or interest rate derivatives. The duration of these instruments is linked to the interest rate reset period. The interest rate risk in a floating rate instrument or in a fixed rate instrument hedged with derivatives is likely to be lesser than that in an equivalent maturity fixed rate instrument. Under some market circumstances the volatility may be of an order greater than what may ordinarily be expected considering only its duration. Hence investors are recommended to consider the unadjusted portfolio maturity of the scheme as well and exercise adequate due diligence when deciding to make their investments. Hedging Position through Interest Rate Swaps as on 31 Jul 2025 is 16.71% of the net assets.
**Total Expense Ratio includes applicable GST.
* For Fund Manager experience, please refer 'For Regular Plan' & 'For Direct Plan'
For last three IDCW, please refer 'Dividend History'.
For scheme performance, please refer 'For Regular Plan' & 'For Direct Plan'