(ERSTWHILE KNOWN AS KOTAK EQUITY HYBRID FUND)
An open ended hybrid scheme investing predominantly in equity and equity related instruments
(ERSTWHILE KNOWN AS KOTAK EQUITY HYBRID FUND)
An open ended hybrid scheme investing predominantly in equity and equity related instruments
 |
 |
 
|
|
|
|
| Issuer/Instrument | Rating | % to Net Assets |
|---|---|---|
| Equity & Equity related |
||
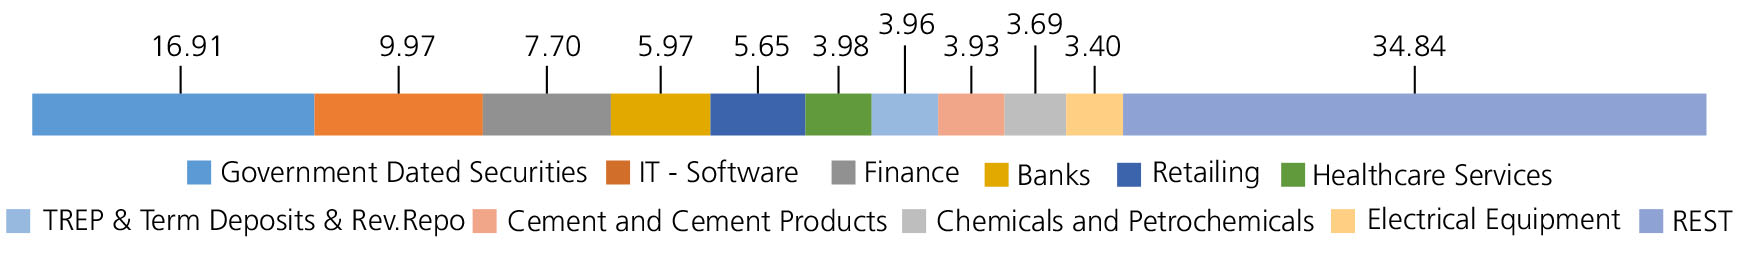
| IT - Software | 9.97 | |
| Infosys Ltd. | 2.47 | |
| Wipro Ltd. | 1.97 | |
| Oracle Financial Services Software Ltd | 1.72 | |
| Mphasis Ltd | 1.31 | |
| Tata Consultancy Services Ltd. | 1.23 | |
| Birlasoft Ltd. | 0.68 | |
| Tech Mahindra Ltd. | 0.59 | |
| Finance | 7.70 | |
| Power Finance Corporation Ltd. | 2.14 | |
| BAJAJ FINANCE LTD. | 2.07 | |
| Cholamandalam Investment and Finance Company Ltd. | 1.13 | |
| REC LTD | 1.08 | |
| SHRIRAM FINANCE LTD. | 0.84 | |
| LIC Housing Finance Ltd. | 0.44 | |
| Banks | 5.97 | |
| HDFC Bank Ltd. | 4.42 | |
| ICICI Bank Ltd. | 1.49 | |
| INDIAN BANK | 0.06 | |
| Retailing | 5.65 | |
| ETERNAL LIMITED | 3.65 | |
| VISHAL MEGA MART LIMITED | 1.09 | |
| SWIGGY LTD | 0.91 | |
| Healthcare Services | 3.98 | |
| Fortis Healthcare India Ltd | 3.26 | |
| MAX HEALTHCARE INSTITUTE LTD. | 0.72 | |
| Cement and Cement Products | 3.93 | |
| Ultratech Cement Ltd. | 2.80 | |
| JK Cement Ltd. | 1.13 | |
| Chemicals and Petrochemicals | 3.69 | |
| SRF Ltd. | 1.52 | |
| SOLAR INDUSTRIES INDIA LIMITED | 1.36 | |
| Deepak Nitrite Ltd. | 0.81 | |
| Electrical Equipment | 3.40 | |
| GE VERNOVA T&D INDIA LIMITED | 2.32 | |
| Apar Industries Limited | 1.08 | |
| Pharmaceuticals and Biotechnology | 3.17 | |
| Ipca Laboratories Ltd. | 1.23 | |
| Sun Pharmaceuticals Industries Ltd. | 1.19 | |
| JB CHEMICALS & PHARMACEUTICALS LTD. | 0.75 | |
| Telecom - Services | 3.00 | |
| Bharti Airtel Ltd | 1.83 | |
| Bharti Airtel Ltd - Partly Paid Shares | 1.17 | |
| Consumer Durables | 2.60 | |
| Havells India Ltd. | 1.33 | |
| Century Plyboards (India) Ltd. | 1.27 | |
| Power | 2.28 | |
| NTPC LTD | 2.28 | |
| Aerospace and Defense | 2.07 | |
| Bharat Electronics Ltd. | 2.07 | |
| Petroleum Products | 1.89 | |
| Bharat Petroleum Corporation Ltd. | 1.38 | |
| RELIANCE INDUSTRIES LTD. | 0.51 | |
| Auto Components | 1.70 | |
| UNO MINDA LIMITED | 0.99 | |
| Schaeffler India Ltd | 0.71 | |
| Capital Markets | 1.57 | |
| Prudent Corporate Advisory Services Ltd. | 0.84 | |
| NUVAMA WEALTH MANAGEMENT LIMITED | 0.73 | |
| Construction | 1.47 | |
| TECHNO ELECTRIC & ENGINEERING COMPANY LIMITED | 1.47 | |
| Realty | 1.16 | |
| Mahindra Lifespace Developers Ltd | 0.67 | |
| Oberoi Realty Ltd | 0.49 | |
| Beverages | 1.20 | |
| UNITED SPIRITS LTD. | 1.20 | |
| Diversified FMCG | 1.13 | |
| ITC Ltd. | 1.13 | |
| Automobiles | 1.10 | |
| Mahindra & Mahindra Ltd. | 1.10 | |
| Industrial Products | 1.01 | |
| Polycab India Ltd. | 1.01 | |
| Insurance | 0.99 | |
| ICICI Lombard General Insurance Company Ltd | 0.99 | |
| Personal Products | 0.80 | |
| Emami Ltd. | 0.80 | |
| Ferrous Metals | 0.71 | |
| Jindal Steel & Power Ltd. | 0.71 | |
| Oil | 0.62 | |
| OIL INDIA LIMITED | 0.62 | |
| Agricultural, Commercial and Construction Vehicles | 0.31 | |
| V.S.T Tillers Tractors Ltd | 0.31 | |
| Equity & Equity related - Total | 73.07 | |
| Debt Instruments | ||
| Debentures and Bonds | ||
| Corporate Debt/Financial Institutions | ||
| ADITYA BIRLA CAPITAL LTD | ICRA AAA | 0.09 |
| Larsen and Toubro Ltd. | CRISIL AAA | 0.06 |
| Corporate Debt/Financial Institutions - Total | 0.15 | |
| Public Sector Undertakings | ||
| TELANGANA STATE INDUSTRIAL INFRASTRUCTURE CORPORATION LTD. | FITCH AA(CE) | 0.82 |
| REC LTD | CRISIL AAA | 0.62 |
| Power Finance Corporation Ltd. | CRISIL AAA | 0.41 |
| SMALL INDUSTRIES DEVELOPMENT BANK OF INDIA | CRISIL AAA | 0.32 |
| U P Power Corporation Ltd ( Guaranteed By UP State Government ) | CRISIL A+(CE) | 0.03 |
| Public Sector Undertakings - Total | 2.20 | |
| Government Dated Securities | ||
| 7.34% Central Government | SOV | 4.43 |
| 7.30% Central Government(^) | SOV | 3.79 |
| 6.90% Central Government | SOV | 2.48 |
| 7.09% Central Government | SOV | 2.23 |
| 6.92% Central Government | SOV | 1.10 |
| 6.79% Central Government | SOV | 0.72 |
| 7.25% Central Government | SOV | 0.52 |
| 7.10% Central Government | SOV | 0.27 |
| GS CG 15/10/2038 - (STRIPS) | SOV | 0.16 |
| GS CG 22/10/2038 - (STRIPS) | SOV | 0.16 |
| 7.21% Karnataka State Govt-Karnataka | SOV | 0.13 |
| GS CG 15/04/2036 - (STRIPS) | SOV | 0.09 |
| 7.62% Haryana State Govt-Haryana | SOV | 0.07 |
| 7.67% Punjab State Govt-Punjab | SOV | 0.07 |
| 8.00% Kerala State Govt-Kerala | SOV | 0.07 |
| 8.15% Tamil Nadu State Govt-Tamil Nadu | SOV | 0.07 |
| GS CG 25/11/2043 - (STRIPS) | SOV | 0.07 |
| 7.18% Central Government(^) | SOV | 0.06 |
| 8.01% Tamil Nadu State Govt-Tamil Nadu | SOV | 0.06 |
| GS CG 22/10/2036 - (STRIPS) | SOV | 0.06 |
| GS CG 22/10/2039 - (STRIPS) | SOV | 0.05 |
| 7.26% Central Government | SOV | 0.04 |
| 7.39% Tamil Nadu State Govt-Tamil Nadu | SOV | 0.03 |
| 7.71% Gujarat State Govt-Gujarat | SOV | 0.03 |
| GS CG 19/06/2036 - (STRIPS) | SOV | 0.03 |
| 7.71% Andhra Pradesh State Govt-Andhra Pradesh | SOV | 0.02 |
| 7.78% Rajasthan State Govt-Rajasthan | SOV | 0.02 |
| GS CG 22/04/2041 - (STRIPS) | SOV | 0.02 |
| GS CG 22/04/2042 - (STRIPS) | SOV | 0.02 |
| 6.91% Rajasthan State Govt-Rajasthan | SOV | 0.01 |
| GS CG 22/08/2026 - (STRIPS) | SOV | 0.01 |
| GS CG 22/02/2027 - (STRIPS) | SOV | 0.01 |
| GS CG 23/12/2025 - (STRIPS) | SOV | 0.01 |
| Government Dated Securities - Total | 16.91 | |
| Money Market Instruments | ||
| Commercial Paper(CP)/Certificate of Deposits(CD) | ||
| Corporate Debt/Financial Institutions | ||
| BAJAJ FINANCIAL SECURITIES LIMITED | CRISIL A1+ | 0.63 |
| Corporate Debt/Financial Institutions - Total | 0.63 | |
| Public Sector Undertakings | ||
| CANARA BANK | CRISIL A1+ | 1.90 |
| Public Sector Undertakings - Total | 1.90 | |
| Triparty Repo | 3.96 | |
| Real Estate & Infrastructure Investment Trusts | ||
| MINDSPACE BUSINESS PARKS REIT | Realty | 0.19 |
| BROOKFIELD INDIA REAL ESTATE TRUST | Realty | 0.09 |
| Real Estate & Infrastructure Investment Trusts - Total | 0.28 | |
| Net Current Assets/(Liabilities) | 0.90 | |
| Grand Total | 100.00 | |
| | ||
| Monthly SIP of (₹) 10000 | Since Inception | 10 years | 7 years | 5 years | 3 years | 1 year |
| Total amount invested (₹) | 12,90,000 | 12,00,000 | 8,40,000 | 6,00,000 | 3,60,000 | 1,20,000 |
| Total Value as on July 31, 2025 (₹) | 28,83,494 | 25,79,035 | 15,14,099 | 8,91,669 | 4,53,318 | 1,25,030 |
| Scheme Returns (%) | 14.23 | 14.64 | 16.54 | 15.86 | 15.57 | 7.91 |
| NIFTY 50 Hybrid Composite Debt 65:35 Index TRI Returns (%) | 12.04 | 12.28 | 12.61 | 11.80 | 11.54 | 6.64 |
| Alpha* | 2.19 | 2.35 | 3.93 | 4.06 | 4.04 | 1.27 |
| NIFTY 50 Hybrid Composite Debt 65:35 Index TRI (₹)# | 25,39,493 | 22,73,945 | 13,16,270 | 8,06,793 | 4,27,732 | 1,24,229 |
| Nifty 50 (TRI) (₹)^ | 28,46,819 | 25,49,389 | 14,39,504 | 8,55,947 | 4,37,497 | 1,23,612 |
| Nifty 50 (TRI) Returns (%) | 14.01 | 14.42 | 15.12 | 14.20 | 13.10 | 5.66 |
| Regular | Direct | |
| Growth | Rs62.3318 | Rs73.2367 |
| IDCW | Rs36.6318 | Rs44.8952 |
A) Regular Plan B) Direct Plan
Options: Payout of IDCW, Reinvestment of IDCW & Growth (applicable for all plans)
| Fund Manager* | Mr. Atul Bhole & Mr. Abhishek Bisen |
| Benchmark | Nifty 50 Hybrid Composite Debt 65:35 Index TRI |
| Allotment date | November 25, 1999 |
| AAUM | Rs7,843.50 crs |
| AUM | Rs7,864.24 crs |
| Folio count | 1,52,123 |
Trustee’s Discretion
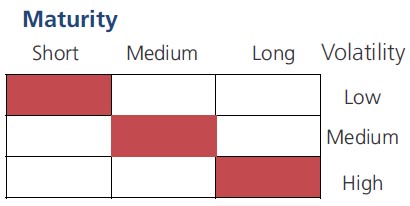
| Average Maturity | 19.63 yrs |
| Modified Duration | 7.77 yrs |
| Macaulay Duration | 8.05 yrs |
| Annualised YTM* | 6.72% |
| $Standard Deviation | 10.48% |
| $Beta | 1.13 |
| $Sharpe## | 0.97 |
| ^^P/E$$ | 27.62 |
| ^^P/BV$$ | 4.39 |
| Portfolio Turnover | 64.70% |
$$Equity Component of the Portfolio.
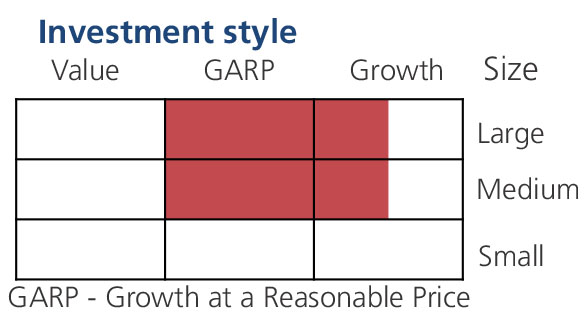
| Large Cap | 43.86% |
| Mid Cap | 19.80% |
| Small Cap | 9.41% |
| Debt & Money Market | 26.93% |
*% of Net Asset
Initial & Additional Investment
• Rs100 and any amount thereafter
Systematic Investment Plan (SIP)
• Rs 100 and any amount thereafter
• 5 years & above
Entry Load: Nil. (applicable for all plans)
Exit Load:
• For redemption / switch out of upto 8% of
the initial investment amount (limit)
purchased or switched in within 1 year from
the date of allotment: Nil.
• If units redeemed or switched out are in
excess of the limit within 1 year from the
date of allotment: 1%
• If units are redeemed or switched out on
or after 1 year from the date of allotment:
NIL
| Regular Plan: | 1.75% |
| Direct Plan: | 0.47% |
Folio Count data as on 30th June 2025.
Fund
Benchmark: Nifty 50 Hybrid Composite Debt 65:35 Index TRI
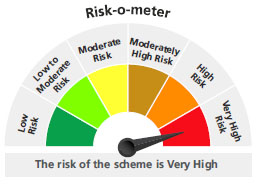
This product is suitable for investors who are seeking*:
- Long term capital growth
- Investment in equity & equity related securities balanced with income generation by investing in debt & money.
* Investors should consult their financial advisors if in doubt about whether the product is suitable for them.
For latest Riskometer, investors may refer to an addendum issued or updated on website at www.kotakmf.com
## Risk rate assumed to be 5.54% (FBIL Overnight MIBOR rate as on 31st July 2025).**Total Expense Ratio includes applicable GST.
* For Fund Manager experience, please refer 'For Regular Plan' & 'For Direct Plan'
For last three IDCW, please refer 'Dividend History'.
For scheme performance, please refer 'For Regular Plan' & 'For Direct Plan'