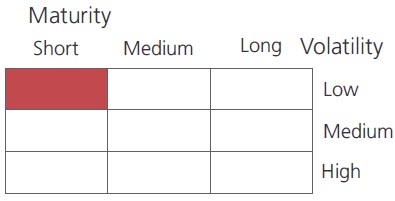
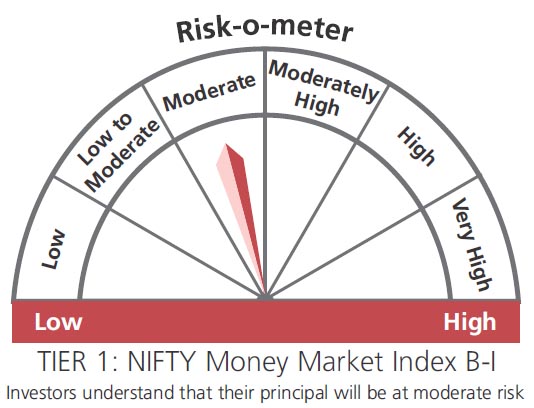
An open ended debt scheme investing in money market instruments
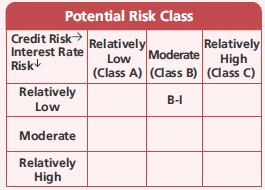
A relatively low interest rate risk and moderate credit risk
An open ended debt scheme investing in money market instruments
A relatively low interest rate risk and moderate credit risk
 |
 |
 
|
|
|
|
| Issuer/Instrument | Industry/ Rating |
% to Net Assets |
|---|---|---|
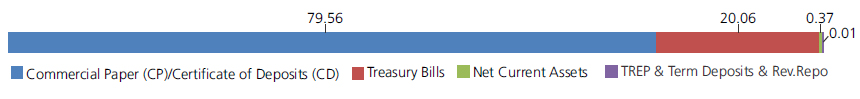
| Money Market Instruments | ||
| Commercial Paper(CP)/Certificate of Deposits(CD) | ||
| Corporate Debt/Financial Institutions | ||
| HDFC Ltd. | CRISIL A1+ | 7.73 |
| Axis Bank Ltd. | CRISIL A1+ | 6.10 |
| HDFC Bank Ltd. | CRISIL A1+ | 4.44 |
| HDFC Bank Ltd. | CARE A1+ | 3.79 |
| Federal Bank Ltd. | CRISIL A1+ | 2.91 |
| Piramal Enterprises Ltd. | CRISIL A1+ | 2.87 |
| IndusInd Bank Ltd. | CRISIL A1+ | 2.23 |
| Panatone Finvest Ltd. | ICRA A1+ | 2.07 |
| Can Fin Homes Ltd. | ICRA A1+ | 1.67 |
| Hero FinCorp Ltd. | CRISIL A1+ | 1.58 |
| Panatone Finvest Ltd. | CRISIL A1+ | 1.32 |
| Tata Motors Finance Ltd. | ICRA A1+ | 1.28 |
| Motilal Oswal Finvest Ltd. | CRISIL A1+ | 1.00 |
| Motilal Oswal Financial Services Limited | ICRA A1+ | 0.98 |
| Tata Teleservices Limited | CRISIL A1+ | 0.73 |
| Bajaj Finance Ltd. | ICRA A1+ | 0.67 |
| Barclays Investments & Loan (India) Ltd. | CRISIL A1+ | 0.67 |
| L & T Finance Ltd. | CRISIL A1+ | 0.67 |
| Bahadur Chand Investments Private Limited | ICRA A1+ | 0.66 |
| JM Financial Services Limited | CRISIL A1+ | 0.66 |
| JM Financial Products Limited | CRISIL A1+ | 0.65 |
| AU Small Finance Bank Ltd. | FITCH IND A1+ | 0.63 |
| Muthoot Finance Ltd. | CRISIL A1+ | 0.63 |
| Pilani Investment and Industries Corporation Ltd | CRISIL A1+ | 0.63 |
| Tata Capital Housing Finance Ltd. | CRISIL A1+ | 0.63 |
| Tata Motors Finance Holdings Ltd. | ICRA A1+ | 0.63 |
| Aditya Birla Finance Ltd. | ICRA A1+ | 0.50 |
| Godrej Industries Ltd | CRISIL A1+ | 0.41 |
| 360 One Wam Limited | ICRA A1+ | 0.26 |
| LIC Housing Finance Ltd. | CRISIL A1+ | 0.11 |
| Network18 Media & Investments Ltd. | CARE A1+ | 0.03 |
| Tv18 Broadcast Ltd | CARE A1+ | 0.03 |
| Corporate Debt/Financial Institutions - Total | 49.17 | |
| Public Sector Undertakings | ||
| Small Industries Development Bank Of India | CARE A1+ | 4.94 |
| Canara Bank | CRISIL A1+ | 4.12 |
| Union Bank of India | ICRA A1+ | 3.70 |
| Small Industries Development Bank Of India | CRISIL A1+ | 3.64 |
| Bank Of Baroda | FITCH IND A1+ | 3.10 |
| Indian Bank | CRISIL A1+ | 2.86 |
| Union Bank of India | FITCH IND A1+ | 2.56 |
| State Bank Of India. | FITCH IND A1+ | 2.30 |
| National Bank for Agriculture & Rural Development | CRISIL A1+ | 1.27 |
| Punjab National Bank | CARE A1+ | 0.64 |
| Union Bank of India | FITCH A1+(IND) | 0.64 |
| UCO Babk | CRISIL A1+ | 0.62 |
| Public Sector Undertakings - Total | 30.39 | |
| Treasury Bills | ||
| 182 Days Treasury Bill 14/09/2023 | SOV | 4.93 |
| 182 Days Treasury Bill 07/09/2023 | SOV | 4.28 |
| 182 Days Treasury Bill 31/08/2023 | SOV | 3.30 |
| 182 Days Treasury Bill 22/09/2023 | SOV | 2.63 |
| 182 Days Treasury Bill 22/06/2023 | SOV | 2.34 |
| 182 Days Treasury Bill 15/06/2023 | SOV | 1.34 |
| 364 Days Treasury Bill 14/03/2024 | SOV | 0.64 |
| 364 Days Treasury Bill 15/06/2023 | SOV | 0.23 |
| 364 Days Treasury Bill 29/06/2023 | SOV | 0.17 |
| 91 Days Treasury Bill 04/05/2023 | SOV | 0.17 |
| 182 Days Treasury Bill 08/06/2023 | SOV | 0.03 |
| Treasury Bills - Total | 20.06 | |
| Triparty Repo | 0.01 | |
| Net Current Assets/(Liabilities) | 0.37 | |
| Grand Total | 100.00 | |

| Monthly SIP of (₹) 10000 | Since Inception | 10 years | 7 years | 5 years | 3 years | 1 year |
| Total amount invested (₹) | 23,70,000 | 12,00,000 | 8,40,000 | 6,00,000 | 3,60,000 | 1,20,000 |
| Total Value as on Mar 31, 2023 (₹) | 50,33,418 | 16,58,980 | 10,30,552 | 6,86,520 | 3,88,165 | 1,24,113 |
| Scheme Returns (%) | 7.08 | 6.31 | 5.76 | 5.34 | 4.97 | 6.46 |
| Nifty Money Market Index B-I Returns (%) | 7.13 | 6.06 | 5.44 | 5.05 | 4.85 | 6.49 |
| Alpha | -0.06 | 0.26 | 0.32 | 0.28 | 0.11 | -0.03 |
| Nifty Money Market Index B-I (₹)# | 50,65,225 | 16,37,065 | 10,18,870 | 6,81,649 | 3,87,504 | 1,24,134 |
| Nifty Money Market Index Returns (%) | 7.12 | 6.09 | 5.49 | 5.11 | 4.89 | 6.46 |
| Alpha | -0.05 | 0.22 | 0.27 | 0.23 | 0.07 | 0.00 |
| Nifty Money Market Index (₹)# | 50,60,051 | 16,40,089 | 10,20,808 | 6,82,633 | 3,87,740 | 1,24,114 |
| CRISIL 1 Year T-Bill Index (₹)^ | 44,90,886 | 16,16,534 | 10,13,612 | 6,78,872 | 3,84,322 | 1,23,587 |
| CRISIL 1 Year T-Bill Index Returns (%) | 6.06 | 5.81 | 5.29 | 4.89 | 4.30 | 5.62 |
Alpha is difference of scheme return with benchmark return.
| Growth Option | Rs3803.238 |
| Direct Growth Option | Rs3828.34 |
| Monthly-Reg-Plan-IDCW | Rs1055.389 |
| Monthly-Dir-Plan-IDCW | Rs1093.374 |
A) Regular Plan B) Direct Plan
Options: Payout of IDCW (w.e.f May 15,
2017, Under Monthly IDCW option only),
Reinvestment of IDCW & Growth
(applicable for all plans)
| Fund Manager* | Mr. Deepak Agrawal,
Mr. Manu Sharma &
Mr. Vihag Mishra
(Dedicated fund manager for investments in foreign securities) |
| Benchmark*** | Nifty Money Market Index B-I (Tier 1) Nifty Money Market Index (Tier 2) |
| Allotment date | July 14, 2003 |
| AAUM | Rs14,353.75 crs |
| AUM | Rs11,632.14 crs |
| Folio count | 13,139 |
Monthly (12th of every Month)
| Portfolio Average Maturity | 0.64 yrs |
| IRS Average Maturity* | - |
| Net Average Maturity | 0.64 yrs |
| Portfolio Modified Duration | 0.64 yrs |
| IRS Modified Duration* | - |
| Net Modified Duration | 0.64 yrs |
| Portfolio Macaulay Duration | 0.64 yrs |
| IRS Macaulay Duration* | - |
| Net Macaulay Duration | 0.64 yrs |
| Annualised YTM* | 7.59% |
| $Standard Deviation | 0.56% |
*in case of semi annual YTM, it will be annualized.
Initial Investment:Rs5000 Under growth,
weekly IDCW and monthly IDCW option & Rs1,00,000 under Daily Reinvestment of
IDCW option,
Additional Investment: Rs1000 & in multiples
of Rs1
Ideal Investment Horizon: 3-6 Months
Entry Load: Nil. (applicable for all plans)
Exit Load:
Nil. (applicable for all plans)
Regular: 0.36%; Direct: 0.26%
Fund
Benchmark
Benchmark
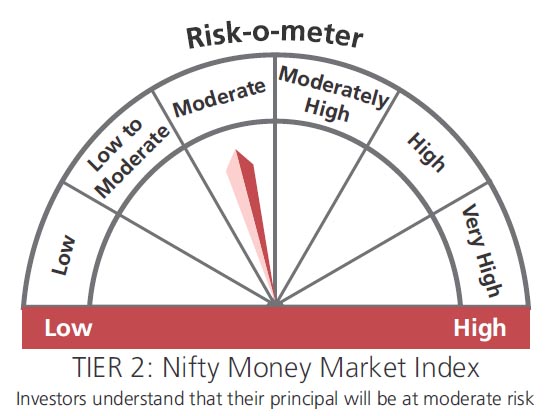
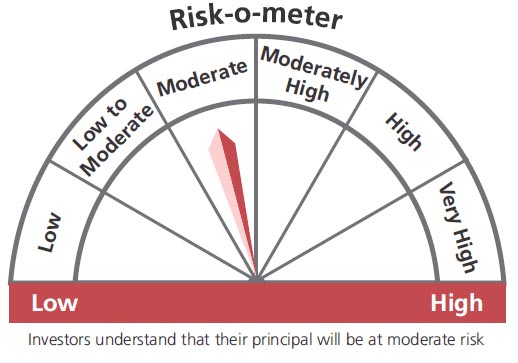
This product is suitable for investors who are seeking*:
- Income over a short term investment horizon
- Investment in money market securities
* Investors should consult their financial advisers if in doubt about whether the product is suitable for them.
The above risk-o—meter is based on the scheme portfolio as on 31st March, 2023.
**Total Expense Ratio includes applicable B30 fee and GST
***As per SEBI circular no. SEBI/HO/IMD/IMD-11 DF3/P/CIR/2021 /652 dated October 27, 2021; AMFI letter no. 35P/MEM-COR/70/2021-22 dated November 25, 2021 and AMFI letter no. 35P/ MEM-COR/ 131 / 2021-22 dated March 31, 2022 with effect from April 01, 2022 ("Effective date"), the first tier benchmark index of the scheme. Existing benchmark will be Second Tier benchmark for aforementioned scheme.
* For Fund Manager experience, please refer 'Our Fund Managers'
For last three IDCW, please refer 'Dividend History'.
For scheme performance, please refer 'Scheme Performances'