| KOTAK SAVINGS FUND
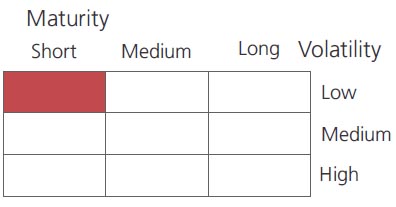
An open ended ultra-short term debt scheme investing in instruments such that the
Macaulay duration of the portfolio is between 3 months and 6 months.
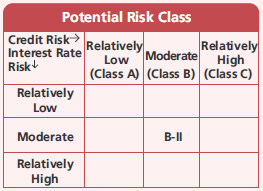
A moderate interest rate risk and moderate credit risk.
An open ended ultra-short term debt scheme investing in instruments such that the
Macaulay duration of the portfolio is between 3 months and 6 months.
A moderate interest rate risk and moderate credit risk.
| KOTAK SAVINGS FUND
An open ended ultra-short term debt scheme investing in instruments such that the
Macaulay duration of the portfolio is between 3 months and 6 months
A moderate interest rate risk and moderate credit risk.
*Interest Rate Swap
*in case of semi annual YTM, it will be annualized.
Source: $ICRAMFI Explorer. Standard Deviation is calculated on Annualised basis using 3 years history of monthly returns.
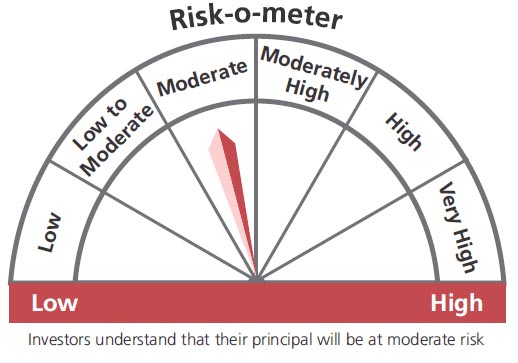
This product is suitable for investors who are seeking*:
An open ended ultra-short term debt scheme investing in instruments such that the
Macaulay duration of the portfolio is between 3 months and 6 months
A moderate interest rate risk and moderate credit risk.
 |
 |
 
|
|
|
|
Investment Objective
The investment objective of the Scheme is
to generate returns through investments in
debt and money market instruments with a
view to reduce the interest rate risk.
However, there is no assurance or
guarantee that the investment objective of
the scheme will be achieved.
The investment objective of the Scheme is
to generate returns through investments in
debt and money market instruments with a
view to reduce the interest rate risk.
However, there is no assurance or
guarantee that the investment objective of
the scheme will be achieved.
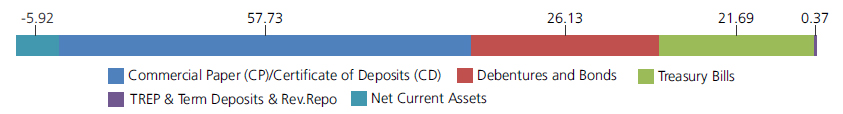
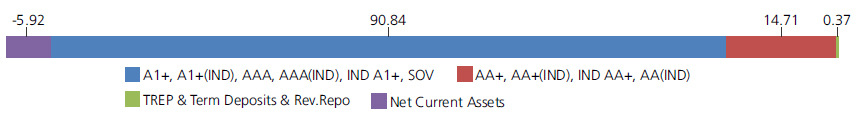
| Issuer/Instrument | Industry/ Rating |
% to Net Assets |
|---|---|---|
| Debt Instruments | ||
| Debentures and Bonds | ||
| Public Sector Undertakings | ||
| Rural Electrification Corporation Ltd. (^) | CRISIL AAA | 1.65 |
| Public Sector Undertakings - Total | 1.65 | |
| Corporate Debt/Financial Institutions | ||
| Cholamandalam Investment and Finance Company Ltd. | ICRA AA+ | 4.14 |
| Mahindra & Mahindra Financial Services Ltd. | FITCH AAA(IND) | 3.61 |
| Shriram Finance Limited (^) | FITCH IND AA+ | 2.55 |
| HDFC Ltd. | CRISIL AAA | 2.17 |
| Tata Power Company Ltd. | FITCH AA(IND) | 2.08 |
| Tata Capital Housing Finance Ltd. | CRISIL AAA | 1.76 |
| Bharti Telecom Ltd. | CRISIL AA+ | 1.55 |
| Shriram Finance Limited | CRISIL AA+ | 1.21 |
| Sundaram Home Finance Ltd | ICRA AAA | 1.04 |
| Godrej Properties Limited | ICRA AA+ | 1.03 |
| Cholamandalam Investment and Finance Company Ltd. | FITCH AA+(IND) | 1.03 |
| Muthoot Finance Ltd. | CRISIL AA+ | 0.51 |
| Bharti Telecom Ltd. | CRISIL AA+ | 0.51 |
| Bajaj Finance Ltd. | CRISIL AAA | 0.41 |
| Axis Finance Ltd. | CRISIL AAA | 0.31 |
| Jamnagar Utilities & Power Private Limited ( Mukesh Ambani Group) | CRISIL AAA | 0.17 |
| Grasim Industries Ltd. | CRISIL AAA | 0.15 |
| Poonawalla Fincorp Limited | CRISIL AA+ | 0.10 |
| Jamnagar Utilities & Power Private Limited ( Mukesh Ambani Group ) | CRISIL AAA | 0.10 |
| Sikka Ports & Terminals Ltd. ( Mukesh Ambani Group ) | CRISIL AAA | 0.05 |
| Corporate Debt/Financial Institutions - Total | 24.48 | |
| Money Market Instruments | ||
| Commercial Paper(CP)/Certificate of Deposits(CD) | ||
| Treasury Bills | ||
| 182 Days Treasury Bill 07/09/2023 | SOV | 8.79 |
| 182 Days Treasury Bill 31/08/2023 | SOV | 5.03 |
| 182 Days Treasury Bill 14/09/2023 | SOV | 5.01 |
| 364 Days Treasury Bill 15/06/2023 | SOV | 1.58 |
| 182 Days Treasury Bill 01/06/2023 | SOV | 1.02 |
| 182 Days Treasury Bill 08/06/2023 | SOV | 0.26 |
| Treasury Bills - Total | 21.69 | |
| Public Sector Undertakings | ||
| Small Industries Development Bank Of India | CARE A1+ | 6.11 |
| Union Bank of India | ICRA A1+ | 5.13 |
| Indian Bank | CRISIL A1+ | 4.37 |
| Union Bank of India | FITCH IND A1+ | 3.90 |
| Bank Of Baroda | FITCH IND A1+ | 2.23 |
| National Bank for Agriculture & Rural Development | CRISIL A1+ | 1.45 |
| Export-Import Bank of India | CRISIL AAA | 1.21 |
| Canara Bank | CRISIL A1+ | 1.05 |
| UCO Bank | CRISIL A1+ | 1.02 |
| Punjab National Bank | CRISIL A1+ | 1.02 |
| State Bank Of India. | FITCH A1+(IND) | 0.97 |
| Public Sector Undertakings - Total | 28.46 | |
| Corporate Debt/Financial Institutions | ||
| HDFC Ltd. | CRISIL A1+ | 9.35 |
| HDFC Bank Ltd. | CRISIL A1+ | 4.99 |
| Federal Bank Ltd. | CRISIL A1+ | 3.44 |
| Panatone Finvest Ltd. | ICRA A1+ | 3.15 |
| Axis Bank Ltd. | CRISIL A1+ | 1.47 |
| HDFC Bank Ltd. | CARE A1+ | 1.45 |
| Panatone Finvest Ltd. | CRISIL A1+ | 1.25 |
| ICICI Bank Ltd. | CRISIL A1+ | 1.13 |
| Bharti Telecom Ltd. | CRISIL A1+ | 1.02 |
| IndusInd Bank Ltd. | CRISIL A1+ | 0.97 |
| Standard Chartered Capital Ltd. | CRISIL A1+ | 0.50 |
| 360 One Wam Limited | ICRA A1+ | 0.21 |
| Godrej Properties Limited | CRISIL A1+ | 0.17 |
| Can Fin Homes Ltd. | ICRA A1+ | 0.17 |
| Corporate Debt/Financial Institutions - Total | 29.27 | |
| Triparty Repo | 0.37 | |
| Net Current Assets/(Liabilities) | -5.92 | |
| Grand Total | 100.00 | |
| Monthly SIP of (₹)10000 | Since Inception | 10 years | 7 years | 5 years | 3 years | 1 year |
| Total amount invested (₹) | 22,40,000 | 12,00,000 | 8,40,000 | 6,00,000 | 3,60,000 | 1,20,000 |
| Total Value as on Mar 31, 2023 (₹) | 45,59,601 | 16,46,295 | 10,21,370 | 6,81,462 | 3,85,882 | 1,23,834 |
| Scheme Returns (%) | 7.10 | 6.16 | 5.51 | 5.04 | 4.57 | 6.01 |
| Nifty Ultra Short Duration Debt Index B-I Returns (%) | 7.56 | 6.58 | 6.00 | 5.60 | 5.27 | 6.74 |
| Alpha | -0.46 | -0.42 | -0.49 | -0.56 | -0.70 | -0.72 |
| Nifty Ultra Short Duration Debt Index B-I (₹)# | 47,87,434 | 16,82,859 | 10,39,369 | 6,91,053 | 3,89,940 | 1,24,289 |
| Nifty Ultra Short Duration Debt Index Returns (%) | 7.49 | 6.50 | 5.94 | 5.54 | 5.28 | 6.86 |
| Alpha | -0.39 | -0.33 | -0.43 | -0.50 | -0.71 | -0.84 |
| Nifty Ultra Short Duration Debt Index (₹)# | 47,49,926 | 16,75,108 | 10,37,099 | 6,89,997 | 3,89,985 | 1,24,366 |
| CRISIL 1 Year T-Bill Index (₹)^ | 41,01,332 | 16,16,534 | 10,13,612 | 6,78,872 | 3,84,322 | 1,23,587 |
| CRISIL 1 Year T-Bill Index Returns (%) | 6.09 | 5.81 | 5.29 | 4.89 | 4.30 | 5.62 |
Scheme Inception : - August 13, 2004. The returns are calculated by XIRR approach assuming investment of ₹10,000/- on the 1st working day of every month. XIRR helps in calculating return on investments given an initial and
final value and a series of cash inflows and outflows and taking the time of investment into consideration. Since inception returns are assumed to be starting from the beginning of the subsequent month from the date of
inception. # Benchmark ; ^ Additional Benchmark.
Alpha is difference of scheme return with benchmark return.
Alpha is difference of scheme return with benchmark return.
NAV
| Growth Option | Rs36.7039 |
| Direct Growth Option | Rs38.0681 |
| Monthly-Reg-Plan-IDCW | Rs10.7593 |
| Monthly-Dir-Plan-IDCW | Rs16.4292 |
Available Plans/Options
A) Regular Plan B) Direct Plan
Options: Payout of IDCW, Reinvestment of
IDCW & Growth (applicable for all plans)
| Fund Manager* | Mr. Deepak Agrawal,
Mr. Manu Sharma &
Mr. Vihag Mishra (Dedicated fund manager for investments in foreign securities) |
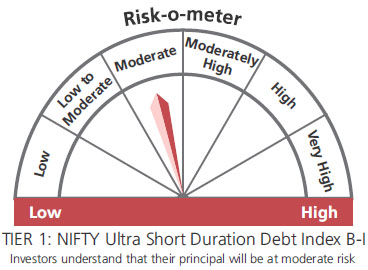
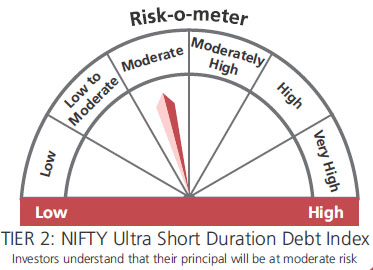
| Benchmark*** | Nifty Ultra Short Duration Debt Index B-I (Tier 1) Nifty Ultra Short Duration Debt Index (Tier 2) |
| Allotment date | August 13, 2004 |
| AAUM | Rs11,798.24 crs |
| AUM | Rs 9,111.84 crs |
| Folio count | 44,999 |
IDCW Frequency
Monthly (12th of every Month)
Ratios
| Portfolio Average Maturity | 0.77 yrs |
| IRS Average Maturity* | - |
| Net Average Maturity | 0.77 yrs |
| Portfolio Modified Duration | 0.57 yrs |
| IRS Modified Duration* | - |
| Net Modified Duration | 0.57 yrs |
| Portfolio Macaulay Duration | 0.58 yrs |
| IRS Macaulay Duration* | - |
| Net Macaulay Duration | 0.58 yrs |
| Annualised YTM* | 7.53% |
| $Standard Deviation | 0.55% |
*Interest Rate Swap
*in case of semi annual YTM, it will be annualized.
Source: $ICRAMFI Explorer. Standard Deviation is calculated on Annualised basis using 3 years history of monthly returns.
Minimum Investment Amount
Initial Investment:(i) Reinvestment of IDCW
& Growth- Rs5000 & above (ii)
Payout of
IDCW (Weekly) - Rs1,00,00,000 &
above
Additional Investment: Rs1000 & in multiples
of Rs1
Ideal Investment Horizon: 3-6 months
Load Structure
Entry Load: Nil. (applicable for all plans)
Exit Load:
Nil. (applicable for all plans)
Total Expense Ratio**
Regular: 0.81%; Direct: 0.37%
Data as on March 31, 2023
Fund
Benchmark
Benchmark
This product is suitable for investors who are seeking*:
- Income over a short term investment horizon
- Investment in debt & money market securities with portfolio Macaulay duration between 3 months & 6 months
* Investors should consult their financial advisers if in doubt about whether the product is suitable for them.
The above risk-o—meter is based on the scheme portfolio as on 31st March, 2023.
(^) Fully or Party blocked against Interest Rate Swap (IRS) Hedging Position through Interest Rate Swaps as on 31 Mar 2023 is 2.64% of the net assets.
**Total Expense Ratio includes applicable B30 fee and GST.
***As per SEBI circular no. SEBI/HO/IMD/IMD-11 DF3/P/CIR/2021 /652 dated October 27, 2021; AMFI letter no. 35P/MEM-COR/70/2021-22 dated November 25, 2021 and AMFI letter no. 35P/ MEM-COR/ 131 / 2021-22 dated March 31, 2022 with effect from April 01, 2022 ("Effective date"), the first tier benchmark index of the scheme. Existing benchmark will be Second Tier benchmark for aforementioned scheme.
* For Fund Manager experience, please refer 'Our Fund Managers'
For last three IDCW, please refer 'Dividend History'.
For scheme performance, please refer 'Scheme Performances'