 
|
|
|
Key Events for the Month of March 2026
• India’s Services Purchasing Managers’ Index (PMI) eased slightly in February, slipping to a two-month low of
58.1 from 58.5 in January, even as manufacturing activity strengthened during the month.
• India’s Manufacturing Purchasing Managers’ Index (PMI) rose to 56.9 in February, up from 55.4 in January.
Manufacturing activity gathered pace during the month, driven by a strong pick-up in domestic demand, even as
export growth slowed to a 17-month low.
• India’s Consumer Price Inflation (CPI) firmed up to 3.21% in February, driven by a rise in prices of food and
beverages, clothing, housing, and utility services.
• India’s Wholesale Price Index (WPI) rose to an 11-month high of 2.13% in February, driven by an uptick in
prices of food and non-food articles, even though vegetable prices eased on a month-on-month basis.
• India’s gross GST collections increased to ₹1.78 lakh crore in March 2026, marking a rise of 8.2% compared to
the previous month.
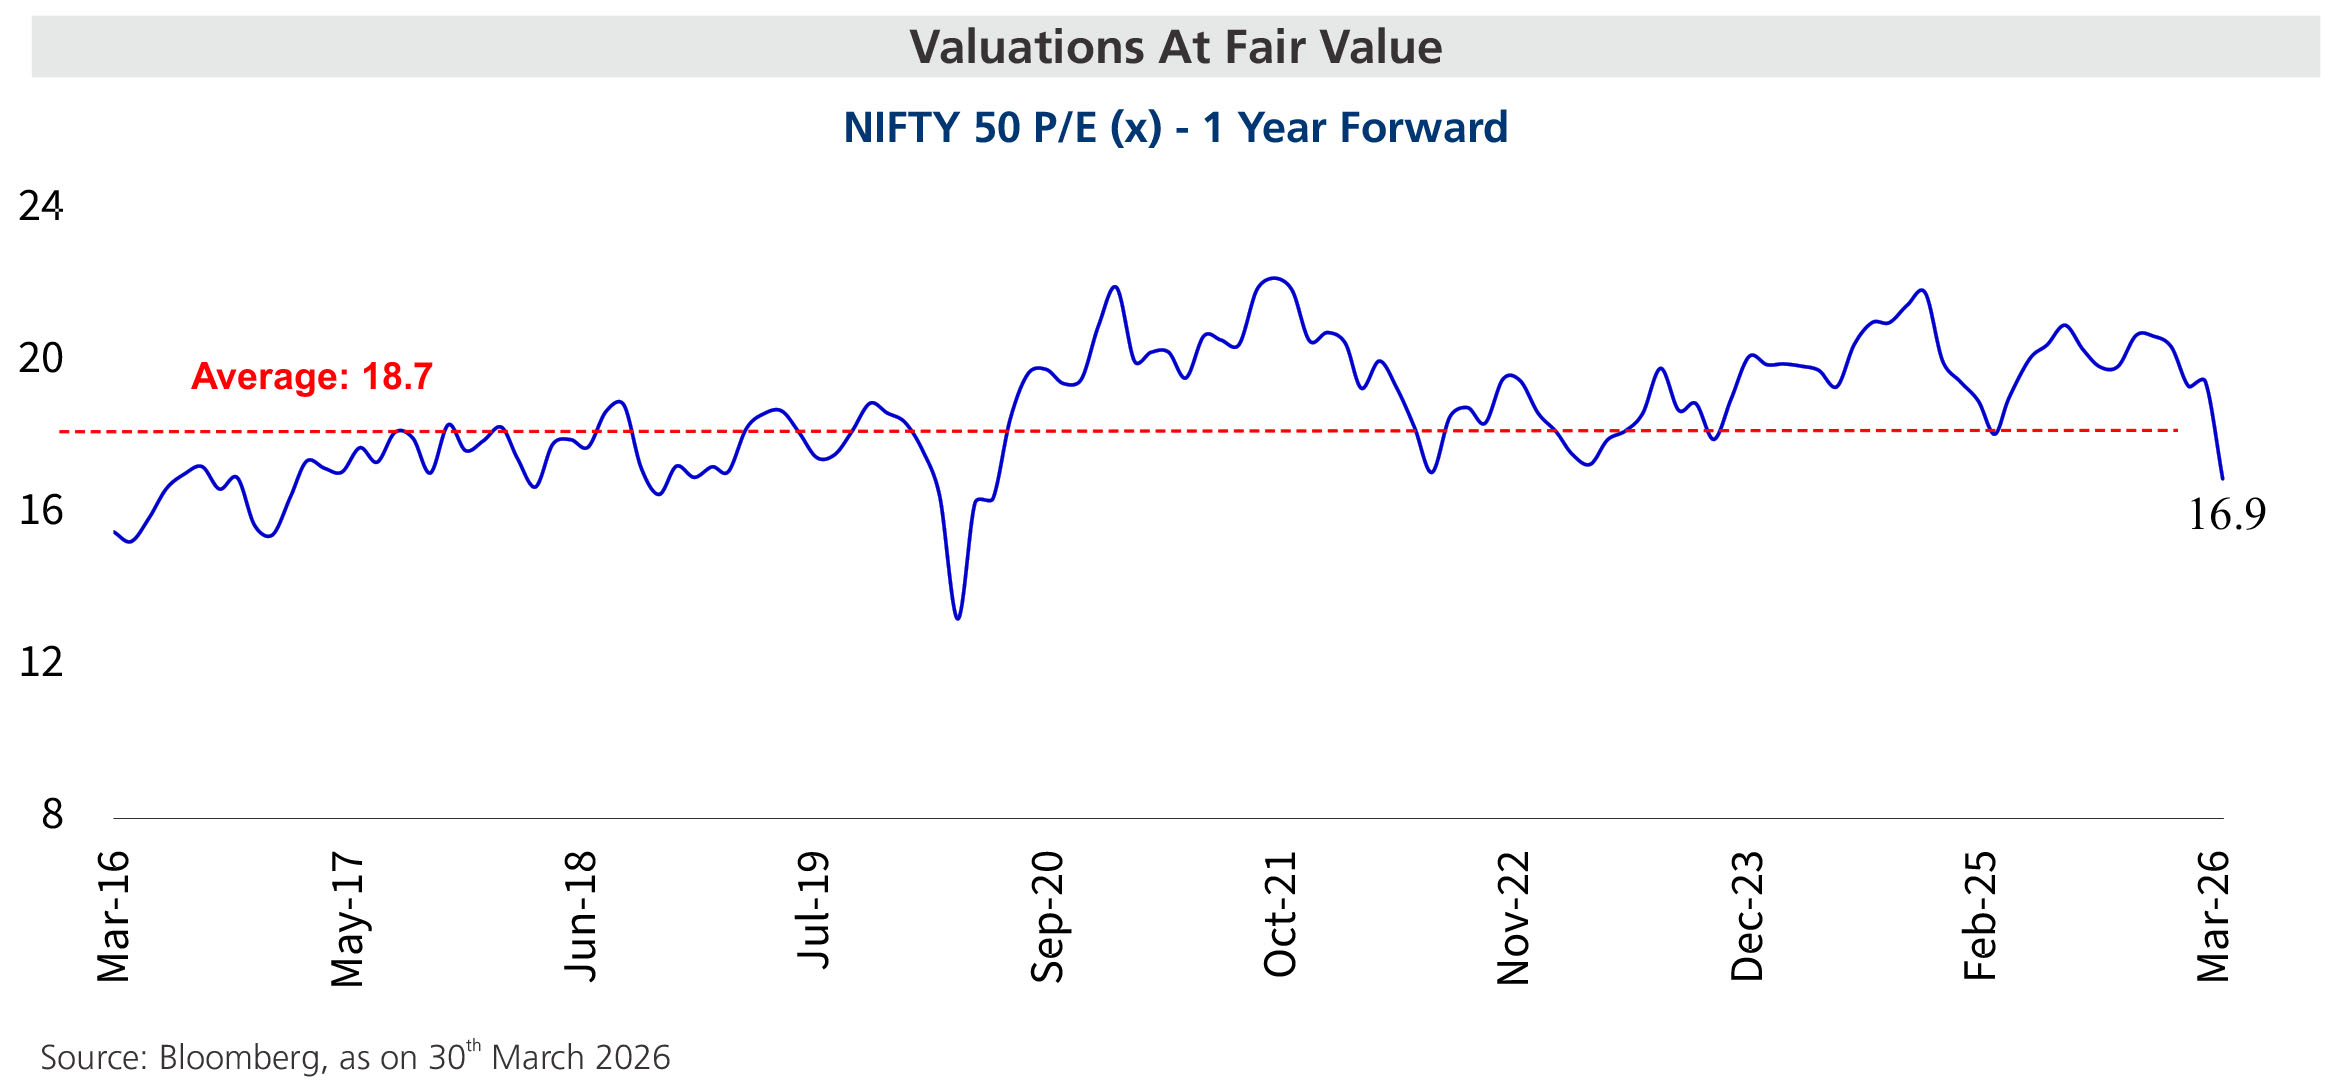
• The month ended on a significantly negative note for Indian equity markets, with the Nifty 50 declining by 11.31%
and the BSE Sensex falling by 11.49%.
| |
Sectoral Index Performance |
| Name | 3 Months | 6 Months | 1 Year | 3 Years | 5 Years | |
| Nifty Auto Index | -15.7% | -10.4% | 11.6% | 24.7% | 19.2% | |
| Nifty Bank Index | -15.6% | -8.0% | -2.5% | 7.4% | 8.6% | |
| Nifty Energy Index | -1.3% | -0.4% | 3.8% | 15.2% | 13.9% | |
| Nifty Financial Services Index | -14.8% | -9.6% | -6.2% | 9.2% | 8.4% | |
| Nifty FMCG Index | -17.9% | -16.8% | -15.0% | -0.3% | 5.4% | |
| Nifty Healthcare Index | -3.0% | 0.4% | 3.8% | 23.1% | 20.6% | |
| Nifty Infrastructure Index | -11.0% | -5.0% | 1.2% | 18.9% | 15.9% | |
| Nifty IT Index | -23.3% | -13.6% | -21.2% | 0.4% | 2.4% | |
| Nifty Media Index | -12.7% | -18.2% | -14.5% | -9.5% | -4.0% | |
| Nifty Metal Index | -0.3% | 11.0% | 22.5% | 26.5% | 22.9% | |
| Nifty Pharma Index | -2.2% | 3.6% | 5.2% | 22.8% | 12.6% | |
| Nifty PSU Bank Index | -7.7% | 4.6% | 25.7% | 28.4% | 29.5% | |
| Nifty Realty Index | -25.8% | -24.9% | -23.5% | 18.9% | 14.3% | |
| BSE Consumer Durables Index | -12.3% | -8.8% | -3.2% | 11.8% | 9.9% | |
| BSE Industrial Index | -10.1% | -9.5% | 1.4% | 23.5% | 26.0% |
Past performance may or may not be sustained in the future.
| |
Global Index Performance |
| Name | 3 Months | 6 Months | 1 Year | 3 Years | 5 Years |
| MSCI World Index | -6.0% | -3.3% | 14.7% | 14.3% | 8.2% |
| MSCI Emerging Index | 0.6% | 4.9% | 28.2% | 12.6% | 1.4% |
| MSCI India index | -13.8% | -8.7% | -3.6% | 11.4% | 9.6% |
| Dow Jones Industrial Average Index | -5.9% | -2.5% | 7.7% | 10.8% | 6.5% |
| Nasdaq Composite Index | -10.5% | -8.2% | 20.2% | 19.4% | 9.4% |
| Nikkei 225 Index | 3.1% | 15.5% | 45.7% | 22.8% | 12.2% |
| Shanghai Composite Index | -1.1% | 1.0% | 17.6% | 6.2% | 2.7% |
| Deutsche Boerse AG german Stock Index DAX | -7.9% | -5.5% | 1.8% | 13.0% | 8.5% |
Past performance may or may not be sustained in the future.