Flexicap fund - An open-ended dynamic equity scheme investing across large cap, mid cap, small cap stocks
Flexicap fund - An open-ended dynamic equity scheme investing across large cap, mid cap, small cap stocks
 |
 |
  
|
|
|
|
| Issuer/Instrument | |
% to Net Assets |
|---|---|---|
| Equity & Equity related | ||
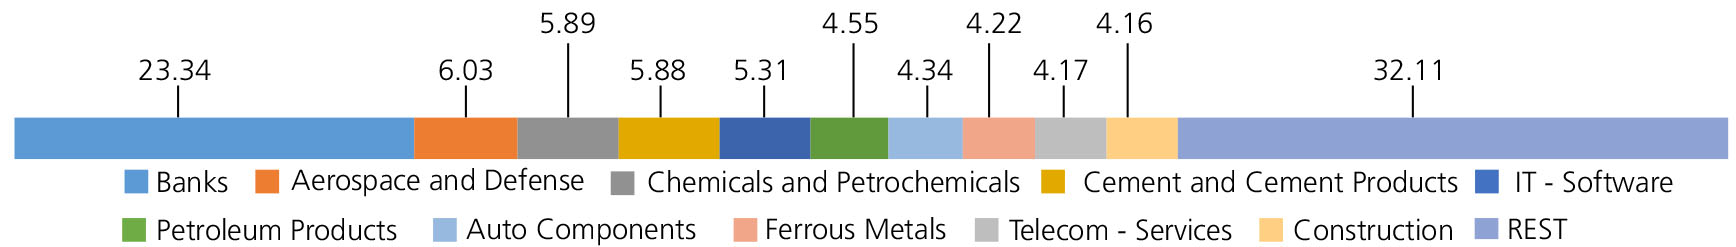
| Banks | 23.34 | |
| HDFC Bank Ltd. | 5.76 | |
| ICICI Bank Ltd. | 5.29 | |
| STATE BANK OF INDIA | 4.65 | |
| Axis Bank Ltd. | 3.71 | |
| AU Small Finance Bank Ltd. | 1.50 | |
| KOTAK MAHINDRA BANK LTD. | 1.30 | |
| IndusInd Bank Ltd. | 1.13 | |
| Aerospace and Defense | 6.03 | |
| Bharat Electronics Ltd. | 6.03 | |
| Chemicals and Petrochemicals | 5.89 | |
| SRF Ltd. | 3.04 | |
| SOLAR INDUSTRIES INDIA LIMITED | 2.41 | |
| Tata Chemicals Ltd | 0.44 | |
| Cement and Cement Products | 5.88 | |
| Ultratech Cement Ltd. | 2.95 | |
| The Ramco Cements Ltd | 1.41 | |
| Dalmia Bharat Limited | 0.96 | |
| Ambuja Cements Ltd. | 0.56 | |
| IT - Software | 5.31 | |
| Infosys Ltd. | 2.25 | |
| Tech Mahindra Ltd. | 1.30 | |
| Tata Consultancy Services Ltd. | 1.22 | |
| HCL Technologies Ltd. | 0.54 | |
| Petroleum Products | 4.55 | |
| RELIANCE INDUSTRIES LTD. | 2.68 | |
| Bharat Petroleum Corporation Ltd. | 1.06 | |
| Indian Oil Corporation Ltd | 0.81 | |
| Auto Components | 4.34 | |
| Bharat Forge Ltd. | 2.20 | |
| MRF Limited | 0.97 | |
| Balkrishna Industries Ltd. | 0.71 | |
| Apollo Tyres Ltd. | 0.46 | |
| Ferrous Metals | 4.22 | |
| Jindal Steel & Power Ltd. | 4.22 | |
| Telecom - Services | 4.17 | |
| Bharti Airtel Ltd | 3.09 | |
| Indus Towers Ltd. | 1.08 | |
| Construction | 4.16 | |
| Larsen And Toubro Ltd. | 3.70 | |
| Kec International Ltd. | 0.46 | |
| Automobiles | 3.98 | |
| Hero MotoCorp Ltd. | 2.02 | |
| Maruti Suzuki India Limited | 1.96 | |
| Retailing | 3.31 | |
| ETERNAL LIMITED | 3.11 | |
| SWIGGY LTD | 0.20 | |
| Capital Markets | 3.09 | |
| BSE LTD. | 1.66 | |
| BILLIONBRAINS GARAGE VENTURES LIMITED (GROWW) | 0.84 | |
| 360 ONE WAM LTD. | 0.59 | |
| Pharmaceuticals and Biotechnology | 2.85 | |
| Zydus Lifesciences Limited | 1.82 | |
| Cipla Ltd. | 0.85 | |
| GlaxoSmithKline Pharmaceuticals Ltd. | 0.18 | |
| Power | 2.80 | |
| NTPC LTD | 1.33 | |
| Power Grid Corporation Of India Ltd. | 1.18 | |
| TORRENT POWER LTD | 0.29 | |
| Finance | 2.37 | |
| BAJAJ FINANCE LTD. | 1.76 | |
| SHRIRAM FINANCE LTD. | 0.61 | |
| Transport Services | 2.12 | |
| Inter Globe Aviation Ltd | 2.12 | |
| Electrical Equipment | 1.41 | |
| Thermax Ltd. | 1.41 | |
| Non - Ferrous Metals | 1.32 | |
| Hindalco Industries Ltd | 1.32 | |
| Gas | 1.29 | |
| Petronet LNG Ltd. | 1.29 | |
| Diversified FMCG | 1.07 | |
| Hindustan Unilever Ltd. | 1.07 | |
| Insurance | 0.80 | |
| Max Financial Services Ltd. | 0.80 | |
| Industrial Products | 0.78 | |
| AIA Engineering Limited. | 0.78 | |
| Beverages | 0.64 | |
| United Breweries Ltd. | 0.64 | |
| Fertilizers and Agrochemicals | 0.57 | |
| Coromandel International Ltd. | 0.57 | |
| Agricultural, Commercial and Constr | 0.52 | |
| BEML LTD. | 0.52 | |
| Personal Products | 0.49 | |
| Godrej Consumer Products Ltd. | 0.49 | |
| Equity & Equity related - Total | 97.30 | |
| Mutual Fund Units | ||
| Kotak Liquid Direct Growth | 0.14 | |
| Mutual Fund Units - Total | 0.14 | |
| Futures | ||
| HCL Technologies Ltd.-APR2026 | 0.49 | |
| Infosys Ltd.-APR2026 | 0.39 | |
| Triparty Repo | 2.55 | |
| Net Current Assets/(Liabilities) | 0.01 | |
| Grand Total | 100.00 | |
| Monthly SIP of (₹) 10000 | Since Inception | 10 years | 7 years | 5 years | 3 years | 1 year |
| Total amount invested (₹) | 19,90,000 | 12,00,000 | 8,40,000 | 6,00,000 | 3,60,000 | 1,20,000 |
| Total Value as on Mar 30, 2026 (₹) | 66,95,864 | 21,89,153 | 12,56,921 | 7,35,619 | 3,76,469 | 1,09,218 |
| Scheme Returns (%) | 13.30 | 11.57 | 11.33 | 8.10 | 2.94 | -16.39 |
| Nifty 500 (TRI) Returns (%) | 12.39 | 12.16 | 11.85 | 7.38 | 1.38 | -18.16 |
| Alpha* | 0.91 | -0.58 | -0.51 | 0.72 | 1.56 | 1.77 |
| Nifty 500 (TRI) (₹)# | 61,29,154 | 22,58,019 | 12,80,219 | 7,22,442 | 3,67,646 | 1,08,015 |
| Nifty 200 (TRI) Returns (%) | 12.10 | 11.81 | 11.35 | 7.16 | 1.56 | -17.69 |
| Alpha* | 1.20 | -0.24 | -0.02 | 0.94 | 1.38 | 1.30 |
| Nifty 200 (TRI) (₹)# | 59,62,035 | 22,17,290 | 12,57,805 | 7,18,502 | 3,68,693 | 1,08,332 |
| Nifty 50 (TRI) (₹)^ | 55,60,508 | 21,22,250 | 11,96,927 | 6,94,711 | 3,62,651 | 1,07,836 |
| Nifty 50 (TRI) Returns (%) | 11.38 | 10.99 | 9.96 | 5.81 | 0.48 | -18.42 |
| Regular | Direct | |
| Growth | Rs76.6265 | Rs86.8344 |
| IDCW | Rs46.2705 | Rs53.0308 |
A) Regular Plan B) Direct Plan
Options: Payout of IDCW, Reinvestment of IDCW & Growth (applicable for all plans)
| Fund Manager* | Mr. Harsha Upadhyaya |
| Benchmark*** | Nifty 500 TRI (Tier 1) Nifty 200 TRI (Tier 2) |
| Allotment date | September 11, 2009 |
| AAUM | Rs53,225.87 crs |
| AUM | Rs50,146.20 crs |
| Folio count | 11,87,237 |
Trustee's Discretion
| Portfolio Turnover | 9.99% |
| $Beta | 0.95 |
| $Sharpe ## | 0.44 |
| $Standard Deviation | 14.36% |
| (P/E) | 24.39 |
| P/BV | 3.22 |
| Large Cap | 68.01% |
| Mid Cap | 26.10% |
| Small Cap | 4.07% |
| Debt & Money Market | 1.82% |
*% of Net Asset
Initial & Additional Investment
• Rs100 and any amount thereafter
Systematic Investment Plan (SIP)
• Rs 100 and any amount thereafter
• 5 years & above
Entry Load: Nil. (applicable for all plans)
Exit Load:
• For redemption / switch out of upto 10%
of the initial investment amount (limit)
purchased or switched in within 1 year from
the date of allotment: Nil.
• If units redeemed or switched out are in
excess of the limit within 1 year from the
date of allotment: 1%
• If units are redeemed or switched out on
or after 1 year from the date of allotment:
NIL.
| Regular Plan: | 1.46% |
| Direct Plan: | 0.59% |
Folio Count data as on 28th February 2026.
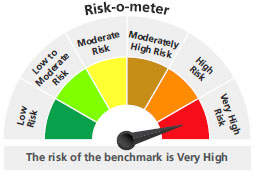
Benchmark - Tier 1 : NIFTY 500 TRI
Benchmark - Tier 2 : Nifty 200 TRI
This product is suitable for investors who are seeking*:
- Long term capital growth
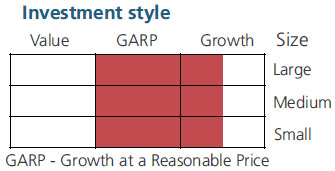
- Investment Portfolio of predominantly equity & equity related securities generally focused on a few selected sectors across market capitalisation.
* Investors should consult their financial advisors if in doubt about whether the product is suitable for them.
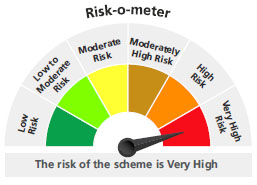
For latest Riskometer, investors may refer to an addendum issued or updated on website at www.kotakmf.com
***As per para 7.2 of SEBI Master circular no. HO/24/13/11(1)2026-IMD-POD-1/I/7602/2026 dated March 20, 2026 The first tier benchmark is reflective of the category of the scheme and the second tier benchmark is demonstrative of the investment style / strategy of the Fund Manager within the category.
## Risk rate assumed to be 6.98% (FBIL Overnight MIBOR rate as on 30th Mar 2026).**Total Expense Ratio includes applicable GST.
* For Fund Manager experience, please refer 'For Regular Plan' & 'For Direct Plan'
For last three IDCW, please refer 'Dividend History'.
For scheme performance, please refer 'For Regular Plan' & 'For Direct Plan'