An Open Ended Scheme investing in Equity, Debt & Money Market Instruments, Commodity ETFs and Exchange Traded Commodity Derivatives.
An Open Ended Scheme investing in Equity, Debt & Money Market Instruments, Commodity ETFs and Exchange Traded Commodity Derivatives.
 |
 |
  
|
|
|
|
| Issuer/Instrument | Rating | % to Net Assets |
|---|---|---|
| Equity & Equity related | ||
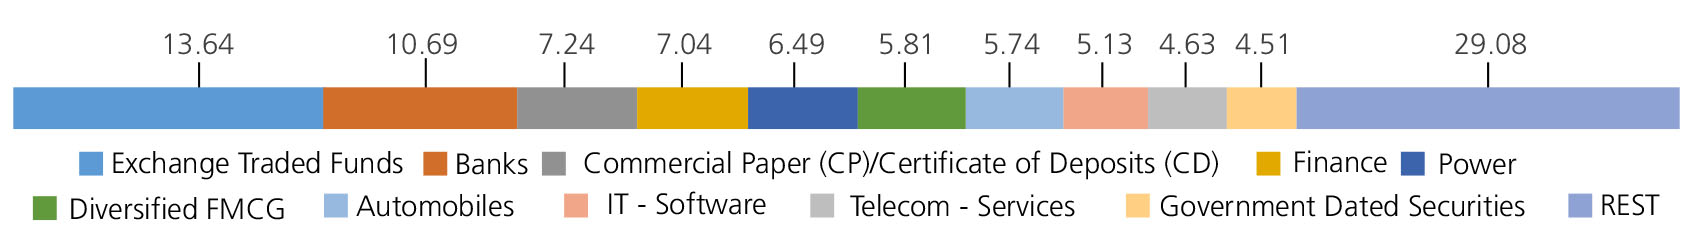
| Banks | 10.69 | |
| STATE BANK OF INDIA | 3.48 | |
| Bank Of Baroda | 1.64 | |
| HDFC Bank Ltd. | 1.60 | |
| ICICI Bank Ltd. | 1.37 | |
| Bandhan Bank Ltd. | 1.17 | |
| KOTAK MAHINDRA BANK LTD. | 1.02 | |
| JAMMU AND KASHMIR BANK LTD. | 0.41 | |
| Finance | 7.04 | |
| Power Finance Corporation Ltd. | 2.94 | |
| SHRIRAM FINANCE LTD. | 2.13 | |
| POONAWALLA FINCORP LTD. | 1.33 | |
| PIRAMAL FINANCE LTD | 0.64 | |
| Power | 6.49 | |
| NTPC LTD | 3.64 | |
| NLC India Ltd. | 2.03 | |
| NTPC GREEN ENERGY LIMITED | 0.82 | |
| Diversified FMCG | 5.81 | |
| ITC Ltd. | 3.51 | |
| Hindustan Unilever Ltd. | 2.30 | |
| Automobiles | 5.74 | |
| Maruti Suzuki India Limited | 3.01 | |
| Hero MotoCorp Ltd. | 2.73 | |
| IT - Software | 5.13 | |
| Infosys Ltd. | 1.76 | |
| Tech Mahindra Ltd. | 1.40 | |
| Tata Consultancy Services Ltd. | 0.62 | |
| ORACLE FINANCIAL SERVICES SOFTWARE LTD | 0.59 | |
| Wipro Ltd. | 0.41 | |
| Mphasis Ltd | 0.35 | |
| Telecom - Services | 4.63 | |
| Indus Towers Ltd. | 2.43 | |
| Bharti Airtel Ltd | 1.62 | |
| Vodafone Idea Ltd | 0.58 | |
| Retailing | 3.32 | |
| ETERNAL LIMITED | 1.59 | |
| SWIGGY LTD | 0.98 | |
| FSN E-COMMERCE VENTURES LTD. | 0.75 | |
| Oil | 3.08 | |
| OIL INDIA LIMITED | 2.49 | |
| Oil & Natural Gas Corporation Ltd. | 0.59 | |
| Beverages | 2.69 | |
| Radico Khaitan Ltd. | 1.43 | |
| United Breweries Ltd. | 1.26 | |
| Petroleum Products | 1.70 | |
| RELIANCE INDUSTRIES LTD. | 1.70 | |
| Pharmaceuticals and Biotechnology | 1.52 | |
| ACUTAAS CHEMICALS LTD | 1.14 | |
| ORCHID PHARMA LTD. | 0.38 | |
| Healthcare Services | 1.43 | |
| PARK MEDI WORLD LIMITED (PARK HOSPITAL) | 1.43 | |
| Agricultural, Commercial and Construction Vehicles | 1.18 | |
| TML COMMERCIAL VEHICLES LIMITED | 1.04 | |
| V.S.T Tillers Tractors Ltd | 0.14 | |
| Non - Ferrous Metals | 1.14 | |
| Hindalco Industries Ltd | 1.14 | |
| Ferrous Metals | 1.11 | |
| Tata Steel Ltd. | 1.11 | |
| Personal Products | 0.84 | |
| Dabur India Ltd. | 0.48 | |
| Emami Ltd. | 0.36 | |
| Auto Components | 0.83 | |
| SAMVARDHANA MOTHERSON INTERNATIONAL LIMITED | 0.83 | |
| Industrial Products | 0.83 | |
| KSH INTERNATIONAL LTD | 0.57 | |
| Subros Ltd. | 0.26 | |
| Industrial Manufacturing | 0.82 | |
| JYOTI CNC AUTOMATION LTD | 0.52 | |
| DEE DEVELOPMENT ENGINEEERS LTD | 0.30 | |
| Entertainment | 0.79 | |
| PVR INOX LIMITED | 0.45 | |
| Sun TV Network Ltd. | 0.34 | |
| Capital Markets | 0.57 | |
| Aditya Birla Sun Life AMC Ltd | 0.57 | |
| Leisure Services | 0.49 | |
| SAPPHIRE FOODS INDIA LTD. | 0.49 | |
| Consumer Durables | 0.47 | |
| Whirlpool of India Ltd. | 0.47 | |
| Electrical Equipment | 0.44 | |
| EMMVEE PHOTOVOLTAIC POWER LIMITED | 0.24 | |
| VIKRAM SOLAR LIMITED | 0.20 | |
| Insurance | 0.42 | |
| LIFE INSURANCE CORPORATION OF INDIA LTD. | 0.42 | |
| Gas | 0.38 | |
| GAIL (India) Ltd. | 0.38 | |
| Chemicals and Petrochemicals | 0.34 | |
| Tata Chemicals Ltd | 0.34 | |
| Construction | 0.21 | |
| Ashoka Buildcon Limited | 0.21 | |
| Household Products | 0.16 | |
| Navneet Education Ltd. | 0.16 | |
| Other Utilities | 0.14 | |
| CONCORD ENVIRO SYSTEMS LIMITED | 0.14 | |
| Minerals and Mining | 0.02 | |
| NMDC Ltd. | 0.02 | |
| Equity & Equity related - Total | 70.45 | |
| Futures | ||
| Vodafone Idea Ltd | Telecom - Services | -0.59 |
| NMDC Ltd. | Minerals and Mining | -0.02 |
| Mutual Fund Units | ||
| KOTAK MUTUAL FUND - KOTAK SILVER ETF | ETF Units | 8.31 |
| KOTAK MUTUAL FUND - KOTAK GOLD ETF | ETF Units | 5.33 |
| Kotak Liquid Direct Growth | Mutual Fund | 0.23 |
| Mutual Fund Units - Total | 13.87 | |
| Debt Instruments | ||
| Debentures and Bonds | ||
| Corporate Debt/Financial Institutions | ||
| INDIGRID INFRASTRUCTURE TRUST | CRISIL AAA | 0.42 |
| AADHAR HOUSING FINANCE LIMITED | ICRA AA | 0.08 |
| Corporate Debt/Financial Institutions - Total | 0.50 | |
| Public Sector Undertakings | ||
| NATIONAL BANK FOR AGRICULTURE & RURAL DEVELOPMENT | CRISIL AAA | 0.25 |
| REC LTD | CRISIL AAA | 0.15 |
| SMALL INDUSTRIES DEVELOPMENT BANK OF INDIA | CRISIL AAA | 0.08 |
| Public Sector Undertakings - Total | 0.48 | |
| Government Dated Securities | ||
| 6.90% Central Government | SOV | 1.62 |
| 7.34% Central Government | SOV | 1.18 |
| 7.09% Central Government | SOV | 0.51 |
| 6.98% West Bengal State Govt-West Bengal | SOV | 0.33 |
| 7.24% Central Government | SOV | 0.27 |
| 7.61% Rajasthan State Govt-Rajasthan | SOV | 0.21 |
| 6.88% Bihar State Govt-Bihar | SOV | 0.20 |
| 7.60% Madhya Pradesh State Govt-Madhya Pradesh | SOV | 0.13 |
| 7.06% Central Government | SOV | 0.04 |
| 7.09% Rajasthan State Govt-Rajasthan | SOV | 0.01 |
| 7.20% Karnataka State Govt-Karnataka | SOV | 0.01 |
| Government Dated Securities - Total | 4.51 | |
| Money Market Instruments | ||
| Commercial Paper(CP)/Certificate of Deposits(CD) | ||
| Corporate Debt/Financial Institutions | ||
| HDFC BANK LTD. | CARE A1+ | 2.34 |
| Corporate Debt/Financial Institutions - Total | 2.34 | |
| Public Sector Undertakings | ||
| PUNJAB NATIONAL BANK | CRISIL A1+ | 1.94 |
| BANK OF BARODA | FITCH A1+ | 1.16 |
| Export-Import Bank of India | CRISIL A1+ | 0.82 |
| NATIONAL BANK FOR AGRICULTURE & RURAL DEVELOPMENT | FITCH A1+ | 0.78 |
| UNION BANK OF INDIA | FITCH A1+ | 0.20 |
| Public Sector Undertakings - Total | 4.90 | |
| Triparty Repo | 2.64 | |
| Infrastructure Investment Trusts | ||
| INDUS INFRA TRUST | Transport Infrastructure | 0.04 |
| Infrastructure Investment Trusts - Total | 0.04 | |
| Net Current Assets/(Liabilities) | 0.27 | |
| Grand Total | 100.00 | |
| Monthly SIP of (Rs) 10000 | Since Inception | 1 Year |
| Total amount invested (₹) | 3,10,000 | 1,20,000 |
| Total Value as on Mar 30, 2026 (₹) | 3,63,102 | 1,25,971 |
| Scheme Returns (%) | 12.37 | 9.46 |
| NIFTY 500 TRI 65% + NIFTY Short Duration Debt Index 25% + Domestic Price of Gold 5% + Domestic Price of Silver 5% Returns (%) | 6.69 | -2.62 |
| Alpha* | 5.69 | 12.08 |
| NIFTY 500 TRI 65% + NIFTY Short Duration Debt Index 25% + Domestic Price of Gold 5% + Domestic Price of Silver 5% (₹)# | 3,38,105 | 1,18,315 |
| Nifty 50 (TRI) (₹)^ | 3,00,445 | 1,07,836 |
| Nifty 50 (TRI) Returns (%) | -2.35 | -18.42 |
| Regular | Direct | |
| Growth | Rs14.5967 | Rs15.1102 |
| IDCW | Rs14.0159 | Rs14.5084 |
A) Regular Plan B) Direct Plan
Options: Payout of IDCW, Reinvestment of
IDCW & Growth (applicable for all plans)
| Fund Manager* |
Mr. Devender Singhal, Mr. Abhishek Bisen, Mr. Hiten Shah & Mr. Jeetu Valechha Sonar |
| Benchmark | Nifty 500 TRI (65%) + Nifty Short Duration Debt Index (25%) + Domestic Price of Gold (5%) + Domestic Price of Silver (5%) |
| Allotment date | September 22, 2023 |
| AAUM | Rs12,430.33 crs |
| AUM | Rs12,073.43 crs |
| Folio count | 2,60,948 |
Trustee's Discretion
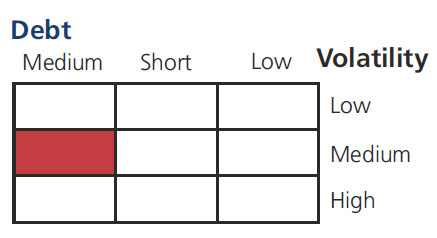
| Average Maturity | 9.84 yrs |
| Modified Duration | 3.60 yrs |
| Macaulay Duration | 3.73 yrs |
| Annualised YTM* | 7.27% |
| $Standard Deviation | 11.43% |
| $Beta | 1.07 |
| $ Sharpe## | 0.78 |
| ^^P/E$$ | 17.87 |
| ^^P/BV$$ | 2.35 |
| Equity Portfolio Turnover$$ | 13.41% |
| Total Portfolio Turnover@ | 66.13% |
$$Equity Component of the Portfolio.
@Total Portfolio Turnover=Equity+Debt+Derivative.
Source: $ICRA MFI Explorer, ^^Bloomberg
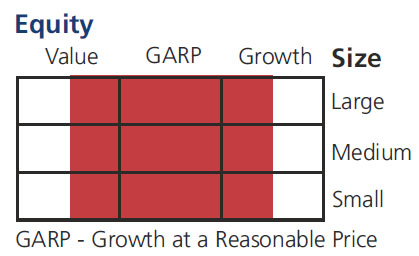
| Large Cap | 43.98% |
| Mid Cap | 13.54% |
| Small Cap | 12.32% |
| Debt & Money Market | 30.16% |
*% of Net Asset
Initial & Additional Investment
• Rs100 and any amount thereafter
Systematic Investment Plan (SIP)
• Rs 100 and any amount thereafter
• 5 years & above
Entry Load: Nil. (applicable for all plans)
Exit Load:
• For redemption / switch out of upto 30%
of the initial investment amount (limit)
purchased or switched in within 1 year from
the date of allotment: Nil.
• If units redeemed or switched out are in
excess of the limit within 1 year from the
date of allotment: 1%
• If units are redeemed or switched out on
or after 1 year from the date of allotment:
NIL
| Regular Plan: | 1.68% |
| Direct Plan: | 0.50% |
Folio Count data as on 28th February 2026.
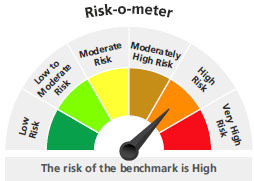
Fund
Benchmark: Nifty 500 TRI (65%) + Nifty Short Duration Debt Index (25%) +Domestic Price of Gold (5%) + Domestic Price of Silver (5%)
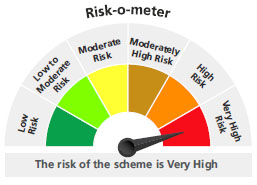
This product is suitable for investors who are seeking*:
- Long-term capital growth
- Equity & Equity related Securities, Debt & Money Market Instruments, Commodity ETFs and Exchange Traded Commodity Derivatives.
* Investors should consult their financial advisors if in doubt about whether the product is suitable for them.
For latest Riskometer, investors may refer to an addendum issued or updated on website at www.kotakmf.com
## Risk rate assumed to be 6.98% (FBIL Overnight MIBOR rate as on 30th Mar 2026). **Total Expense Ratio includes applicable GST.
* For Fund Manager experience, please refer 'For Regular Plan' & 'For Direct Plan'
For scheme performance, please refer 'For Regular Plan' & 'For Direct Plan'