 
|
|
|
Key Events for the Month of May 2025
• India’s Services Purchasing Managers' Index (PMI) for April stood at 58.7, indicating a slight improvement in the
country’s services sector compared to 58.5 in March.
• India's Purchasing Managers' Index (PMI) rose to a 10-month high of 58.2 in April. The seasonally adjusted index
signaled the strongest improvement in the sector’s health since June 2024, driven by faster growth in employment,
production, and stockpiling of purchases.
• India’s retail inflation, measured by the Consumer Price Index (CPI), stood at 3.16% in April 2025. The lowest level since
July 2019. This marks a decline of 0.18% from March’s 3.34%, indicating a steady easing of prices.
• India’s wholesale price index (WPI) based inflation fell sharply to 0.85% in April 2025 from 2.05% in March. The
decline in inflation was largely due to a decline in prices in the fuel & power and primary articles segments, although the
manufacturing sector continued to show resilience.
• India's GST Collection Reaches Rs 2.01 Lakh Crore In May 2025, Up 16.4% YoY. The year-on-year growth was driven
by a 25.2% increase in GST collected from imports and a 13.7% rise from domestic transactions.
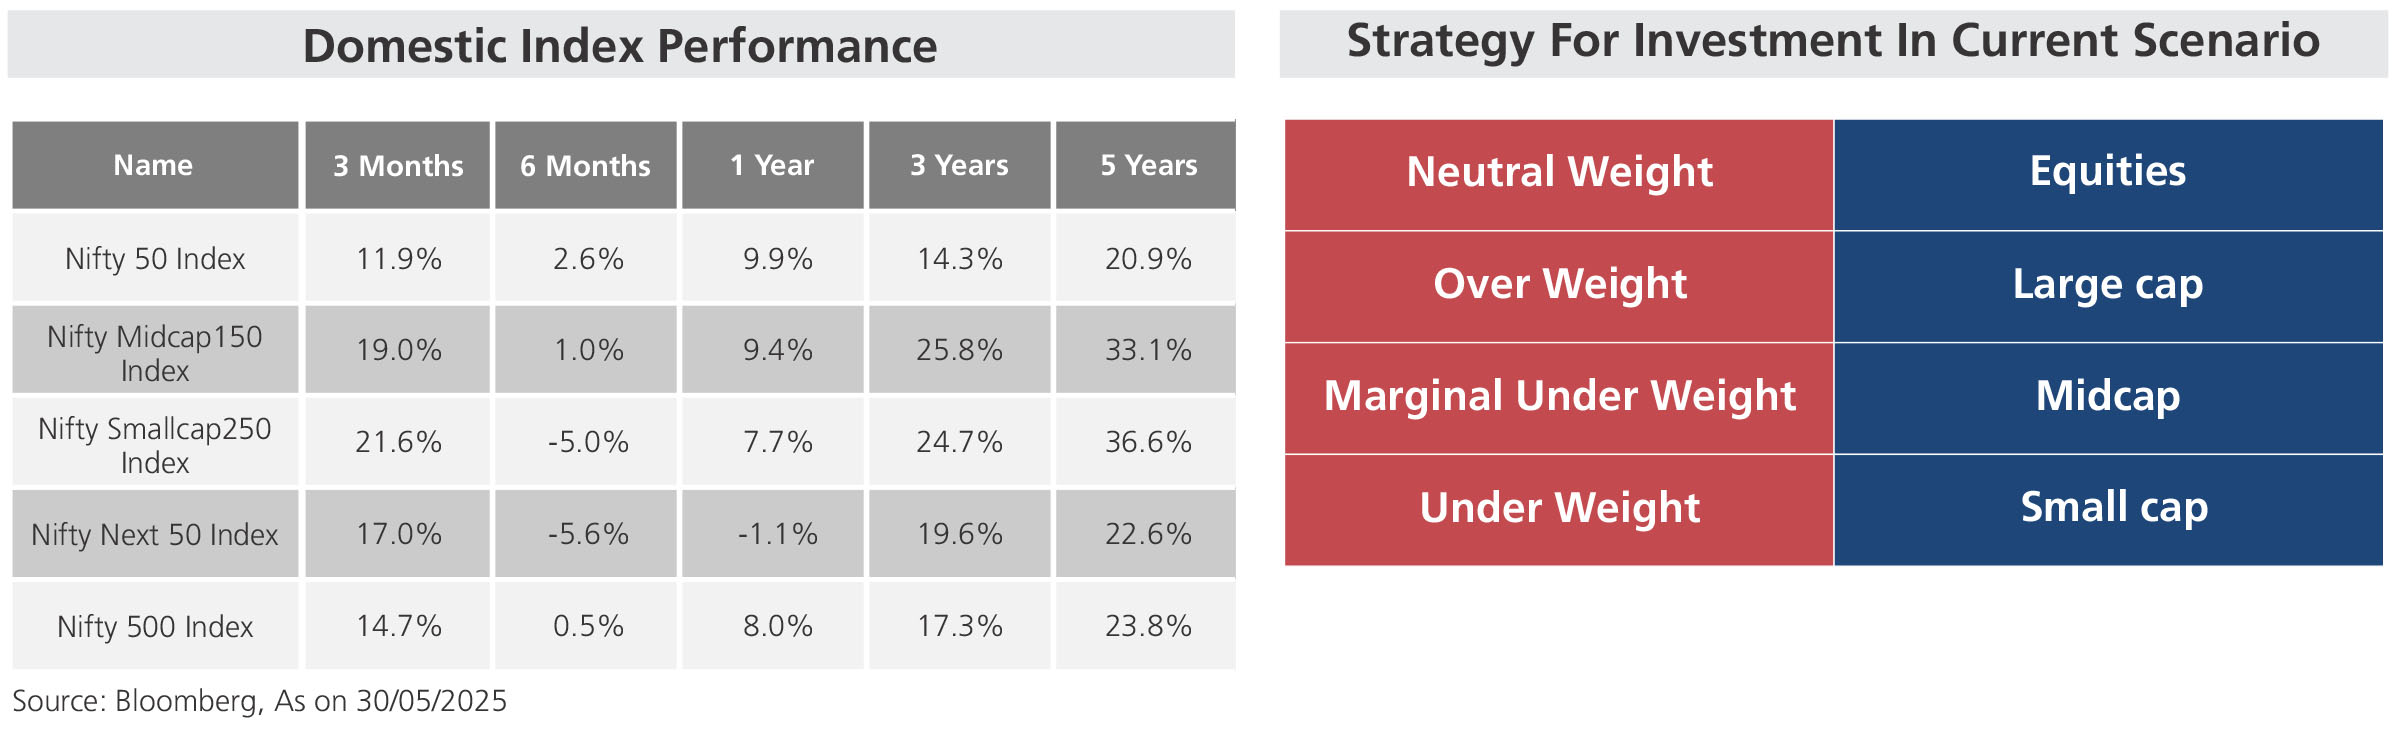
• Indian equity indices ended the month with moderate gains: Nifty 50 up 1.71% and BSE Sensex up 1.51%.
| |
Sectoral Index Performance |
| Name | 3 Months | 6 Months | 1 Year | 3 Years | 5 Years |
| Nifty Auto Index | 13.8% | -0.2% | -0.4% | 26.3% | 30.2% |
| Nifty Bank Index | 15.3% | 7.1% | 13.8% | 16.2% | 23.6% |
| Nifty Energy Index | 19.5% | -4.3% | -10.9% | 11.8% | 22.4% |
| Nifty Financial Services Index | 15.1% | 10.4% | 22.0% | 17.2% | 22.7% |
| Nifty FMCG Index | 9.1% | -4.6% | 2.2% | 12.6% | 13.5% |
| Nifty Healthcare Index | 9.5% | -1.7% | 17.8% | 21.2% | 20.0% |
| Nifty Infrastructure Index | 17.0% | 2.7% | 3.5% | 22.5% | 25.8% |
| Nifty IT Index | 0.0% | -13.5% | 15.2% | 7.9% | 21.6% |
| Nifty Media Index | 23.4% | -14.3% | -8.5% | -5.9% | 7.7% |
| Nifty Metal Index | 11.9% | 1.8% | -5.5% | 19.9% | 37.3% |
| Nifty Pharma Index | 8.2% | -3.6% | 14.1% | 19.4% | 17.0% |
| Nifty PSU Bank Index | 23.4% | 2.4% | -5.6% | 39.4% | 43.9% |
| Nifty Realty Index | 19.0% | -6.9% | -6.9% | 32.1% | 39.4% |
| BSE Consumer Durables Index | 9.4% | -7.2% | 5.5% | 15.1% | 25.0% |
| BSE Industrial Index | 28.7% | -2.0% | 1.0% | 39.4% | 47.8% |
| |
Global Index Performance |
| Name | 3 Months | 6 Months | 1 Year | 3 Years | 5 Years |
| MSCI World Index | 1.5% | 1.4% | 12.1% | 11.4% | 12.4% |
| MSCI Emerging Index | 5.5% | 7.3% | 10.3% | 2.4% | 4.5% |
| MSCI India index | 13.3% | 0.9% | 7.3% | 14.9% | 21.0% |
| Dow Jones Industrial Average Index | -3.6% | -5.9% | 9.3% | 8.6% | 10.7% |
| Nasdaq Composite Index | 1.4% | -0.5% | 14.2% | 16.5% | 15.0% |
| Nikkei 225 Index | 2.2% | -0.6% | -1.4% | 11.6% | 11.6% |
| Shanghai Composite Index | 0.8% | 0.6% | 8.4% | 1.7% | 3.2% |
| Deutsche Boerse AG german Stock Index DAX | 6.4% | 22.3% | 29.7% | 18.6% | 15.7% |