An open ended equity scheme investing in maximum 30 stocks in large-cap, mid-cap and small-cap category
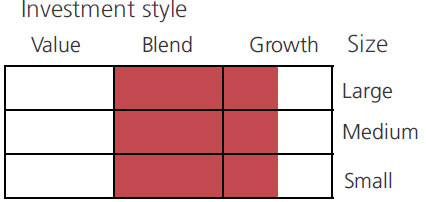
An open ended equity scheme investing in maximum 30 stocks in large-cap, mid-cap and small-cap category
 |
 |
 
|
|
|
|
The investment objective of the scheme is to generate long term capital appreciation/income by investing in equity & equity related instruments across market capitalization of up to 30 companies. However, there is no assurance that the objective of the scheme will be realized.
The investment objective of the scheme is to generate long term capital appreciation/income by investing in equity & equity related instruments across market capitalization of up to 30 companies. However, there is no assurance that the objective of the scheme will be realized.
| Issuer/ Instrument |
Industry/ Rating |
% to Net Assets |
|
|---|---|---|---|
| Equity & Equity related
|
|||
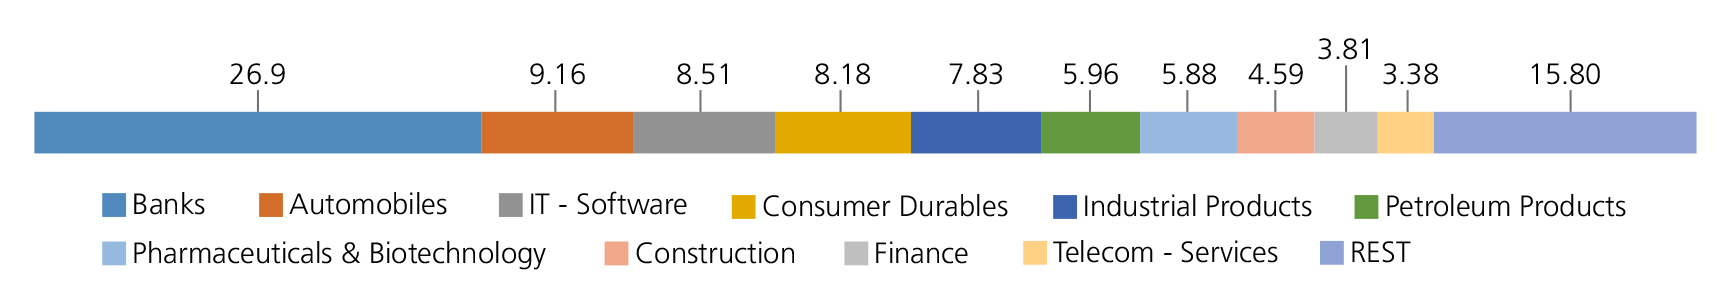
| Banks | 26.90 | ||
| ICICI Bank Ltd. | 8.12 | ||
| HDFC Bank Ltd. | 7.20 | ||
| State Bank Of India | 5.41 | ||
| Axis Bank Ltd. | 4.30 | ||
| AU Small Finance Bank Ltd. | 1.87 | ||
| Automobiles | 9.16 | ||
| Maruti Suzuki India Limited | 4.15 | ||
| Mahindra & Mahindra Ltd. | 2.97 | ||
| Hero MotoCorp Ltd. | 2.04 | ||
| IT - Software | 8.51 | ||
| Infosys Ltd. | 6.18 | ||
| Larsen & Toubro Infotech Ltd | 2.33 | ||
| Consumer Durables | 8.18 | ||
| Bata India Ltd. | 2.60 | ||
| Kajaria Ceramics Ltd. | 2.23 | ||
| Orient Electric Ltd. | 1.71 | ||
| Sheela Foam Ltd | 1.64 | ||
| Industrial Products | 7.83 | ||
| Bharat Forge Ltd. | 2.96 | ||
| Supreme Industries Limited | 2.75 | ||
| Polycab India Ltd. | 2.12 | ||
| Petroleum Products | 5.96 | ||
| Reliance Industries Ltd. | 5.96 | ||
| Pharmaceuticals & Biotechnology | 5.88 | ||
| Sun Pharmaceuticals Industries Ltd. | 3.36 | ||
| Alkem Laboratories Ltd. | 2.52 | ||
| Construction | 4.59 | ||
| Larsen And Toubro Ltd. | 4.59 | ||
| Finance | 3.81 | ||
| Bajaj Finance Ltd. | 2.74 | ||
| Aavas Financiers Ltd. | 1.07 | ||
| Telecom - Services | 3.38 | ||
| Bharti Airtel Ltd | 3.23 | ||
| Bharti Airtel Ltd - Partly Paid Shares | 0.15 | ||
| Aerospace & Defense | 2.98 | ||
| Bharat Electronics Ltd. | 2.98 | ||
| Diversified FMCG | 2.94 | ||
| Hindustan Unilever Ltd. | 2.94 | ||
| Beverages | 2.75 | ||
| United Breweries Ltd. | 2.75 | ||
| Chemicals & Petrochemicals | 2.64 | ||
| SRF Ltd. | 2.64 | ||
| Fertilizers & Agrochemicals | 2.56 | ||
| P I Industries Ltd | 2.56 | ||
| Cement & Cement Products | 0.18 | ||
| The Ramco Cements Ltd | 0.18 | ||
| Equity & Equity related - Total | 98.25 | ||
| Triparty Repo | 1.84 | ||
| Net Current Assets/(Liabilities) | -0.09 | ||
| Grand Total | 100.00 | ||
| | |||
| Monthly SIP of (Rs) 10000 | Since Inception | 3 year | 1 year |
| Total amount invested (₹) | 4,10,000 | 3,60,000 | 1,20,000 |
| Total Value as on Nov 30, 2022 (₹) | 5,70,910 | 4,86,227 | 1,28,498 |
| Scheme Returns (%) | 19.79 | 20.55 | 13.42 |
| Nifty 500 TRI (%) | 22.42 | 23.40 | 17.37 |
| Alpha | -2.63 | -2.85 | -3.95 |
| Nifty 500 TRI (₹)# | 5,95,308 | 5,05,775 | 1,30,938 |
| Nifty 200 (TRI) Returns (%) | 21.77 | 22.80 | 17.99 |
| Alpha | -1.97 | -2.24 | -4.57 |
| Nifty 200 (TRI) (₹)# | 5,89,182 | 5,01,565 | 1,31,321 |
| Nifty 50 (TRI) (₹)^ | 5,84,949 | 4,98,895 | 1,32,346 |
| Nifty 50 (TRI) Returns (%) | 21.31 | 22.41 | 19.66 |
Alpha is difference of scheme return with benchmark return. *All payouts during the period have been reinvested in the units of the scheme at the then prevailing NAV. Returns >= 1 year: CAGR (Compounded Annualised Growth Rate). N.A stands for data not available. Note: Point to Point (PTP) Returns in INR shows the value of 10,000/- investment made at inception. Source: ICRA MFI Explorer.
| Growth option | Rs17.236 |
| Direct Growth option | Rs18.253 |
| Reg-Plan-IDCW | Rs17.236 |
| Dir-Plan-IDCW | Rs18.254 |
A) Regular Plan B) Direct Plan
Options: Payout of IDCW, Reinvestment of
IDCW & Growth (applicable for all plans)
| Fund Manager* | Ms. Shibani Kurian & Mr. Arjun Khanna ( Dedicated Fund Manager for Overseas Investments) |
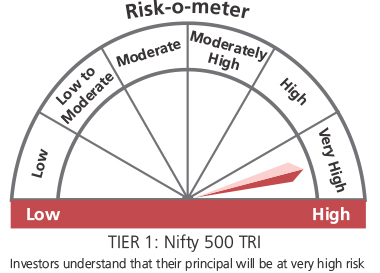
| Benchmark*** | Nifty 500 TRI (Tier 1) Nifty 200 TRI (Tier 2) |
| Allotment date | July 16, 2019 |
| AAUM | Rs2,551.42 crs |
| AUM | Rs2,595.86 crs |
| Folio count | 96,447 |
Trustee's Discretion
| Portfolio Turnover | 22.26% |
| $Beta | 0.94 |
| $Sharpe ## | 0.56 |
| $Standard Deviation | 21.82% |
| (P/E) | 29.6 |
| P/BV | 4.1 |
| IDCW Yield | 0.8 |
Initial Investment: Rs5000 and in multiple of
Rs1 for purchase and for Rs0.01 for switches
Additional Investment: Rs1000 & in
multiples of Rs1
Ideal Investments Horizon: 5 years & above
Entry Load: Nil. (applicable for all plans)
Exit Load:
a) For redemption / switch out of upto 10%
of the initial investment amount (limit)
purchased or switched in within 1 year from
the date of allotment: Nil.
b) If units redeemed or switched out are in
excess of the limit within 1 year from the
date of allotment: 1%
c) If units are redeemed or switched out on
or after 1 year from the date of allotment:
NIL
Regular: 2.07%; Direct: 0.51%
Benchmark
Benchmark
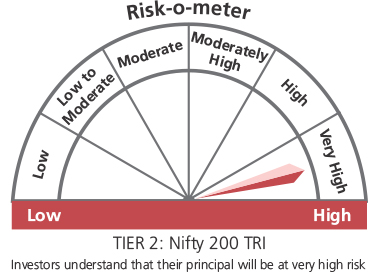
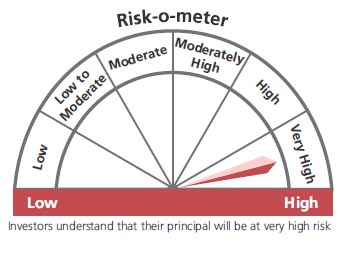
This product is suitable for investors who are seeking*:
- Long term capital growth
- market capitalisation in maximum 30 stocks Investment in equity & equity related securities across
* Investors should consult their financial advisers if in doubt about whether the product is suitable for them.
***As per SEBI Circular dated 27th October 2021 The first tier benchmark is reflective of the category of the scheme and the second tier benchmark is demonstrative of the investment style / strategy of the Fund Manager within the category.
## Risk rate assumed to be 5.86% (FBIL Overnight MIBOR rate as on 30th November 2022). **Total Expense Ratio includes applicable B30 fee and GST.
For Fund Manager experience, please refer 'Our Fund Managers'
For scheme performance, please refer 'Scheme Performances'