An open ended dynamic asset allocation fund
An open ended dynamic asset allocation fund
 |
 |
 
|
|
|
|
The investment objective of the scheme is to generate capital appreciation by investing in a dynamically balanced portfolio of equity & equity related securities and debt & money market securities. There is no assurance or guarantee that the investment objective of the scheme will be achieved.
The investment objective of the scheme is to generate capital appreciation by investing in a dynamically balanced portfolio of equity & equity related securities and debt & money market securities. There is no assurance or guarantee that the investment objective of the scheme will be achieved.
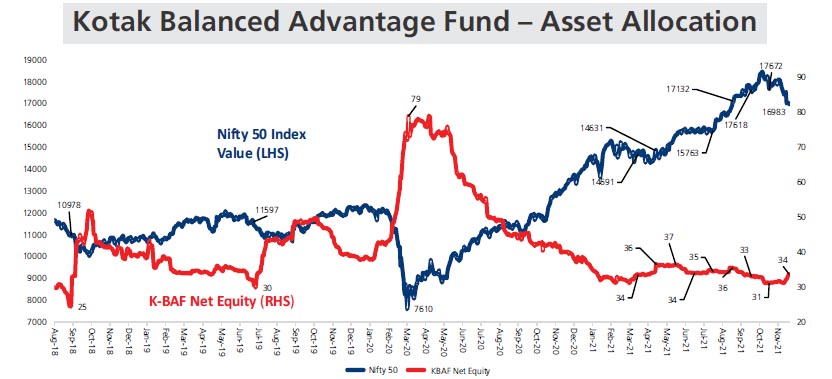
Source: Internal Analysis. As on 30th November 2021. Automatic: A fund that gives you freedom from managing equity and debt
allocation manually during the market ups and down, giving you a balanced growth.
Mutual fund investment are subject to market risk, read all scheme related documents carefully
| Issuer/ Instrument |
Industry/ Rating |
% to Net Assets |
% to Net Assets Derivatives |
| Equity & Equity related | |||
| Adani Port and Special Economic Zone Ltd. | Transportation | 3.44 | -3.45 |
| Reliance Industries Ltd. | Petroleum Products | 3.15 | |
| ICICI Bank Ltd. | Banks | 2.38 | |
| Infosys Ltd. | Software | 2.12 | |
| HDFC Bank Ltd. | Banks | 2.06 | |
| Bharti Airtel Ltd | Telecom - Services | 1.90 | -1.90 |
| Tata Steel Ltd. | Ferrous Metals | 1.73 | -1.73 |
| CNX NIFTY-DEC2021 | -1.64 | ||
| Adani Enterprises Ltd. | Minerals/Mining | 1.39 | -1.39 |
| Persistent Systems Limited | Software | 1.38 | |
| Others | 46.30 | -22.15 | |
| Equity & Equity Related - Total | 65.85 | -32.26 | |
| Mutual Fund Units | 12.40 | ||
| Debt Instruments | |||
| Debentures and Bonds | 1.79 | ||
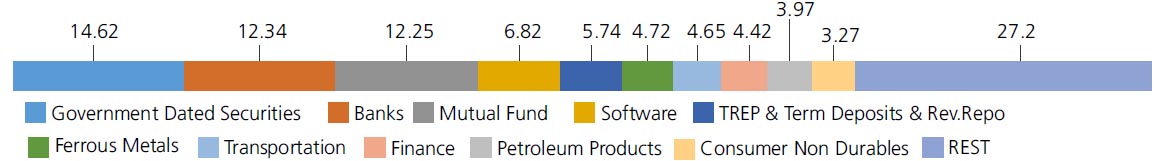
| Government Dated Securities | 14.62 | ||
| Triparty Repo | 5.74 | ||
| Net Current Assets/(Liabilities) | -0.40 | ||
| Grand Total | 100.00 | ||
| Grand Total | 100.00 | ||
For detailed portfolio log on to
https://www.kotakmf.com/Products/funds/hybrid-funds/Kotak-Balanced-Advantage-Fund/Dir-G
Also you can scan the QR code for detailed portfolio.
Mutual Fund Units as provided above is towards margin for derivatives transactions
Equity Derivative Exposuer is 32.26%
| Monthly SIP of (₹) 10000 | Since Inception | 3 years | 1 year |
| Total amount invested (Rs) | 4,00,000 | 3,60,000 | 1,20,000 |
| Total Value as on Nov 30, 2021 (Rs) | 5,09,611 | 4,52,078 | 1,27,885 |
| Scheme Returns (%) | 14.67 | 15.38 | 12.42 |
| NIFTY 50 Hybrid Composite Debt 50:50 Index Returns (%) | 16.14 | 16.87 | 13.94 |
| Alpha | -1.47 | -1.49 | -1.52 |
| NIFTY 50 Hybrid Composite Debt 50:50 Index (Rs)# | 5,21,663 | 4,61,763 | 1,28,835 |
| Nifty 50 (TRI) (Rs)^ | 5,76,926 | 5,13,762 | 1,33,974 |
| Nifty 50 (TRI) Returns (%) | 22.57 | 24.54 | 22.30 |
*All payouts during the period have been reinvested in the units of the scheme at the then prevailing NAV. Returns >= 1 year: CAGR (Compounded Annualised Growth Rate). N.A stands for data not available.
Note: Point to Point (PTP) Returns in INR shows the value of Rs 10,000/- investment made at inception. Source: ICRA MFI Explorer. # Name of Scheme Benchmark. ## Name of Additional Benchmark.
Alpha is difference of scheme return with benchmark return.
| Growth option | Rs14.3420 |
| Direct Growth option | Rs14.9080 |
| Reg-Plan-IDCW | Rs 14.3420 |
| Dir-Plan-IDCW | Rs 14.9080 |
A) Regular Plan B) Direct Plan
Options: Payout of IDCW, Reinvestment of
IDCW & Growth (applicable for all plans)
| Fund Manager | Mr. Harish Krishnan Mr. Hiten Shah Mr. Abhishek Bisen* |
| Benchmark | NIFTY 50 Hybrid Composite Debt 50:50 Index |
| Allotment date | August 3, 2018 |
| AAUM | Rs12,118.02 crs |
| AUM | Rs12,256.08 crs |
| Folio count | 2,09,578 |
Trustee's Discretion
| Portfolio Turnover | 27.09% |
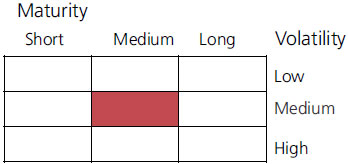
| Portfolio Average Maturity | 7.83% |
| IRS Average Maturity* | 0.30% |
| Net Average Maturity | 8.13% |
| Portfolio Modified Duration | 2.51% |
| IRS Modified Duration* | 0.27% |
| Net Modified Duration | 2.77% |
| Portfolio Macaulay Duration | 2.60% |
| IRS Macaulay Duration* | 0.27% |
| Net Macaulay Duration | 2.88% |
| YTM | 6.26% |
| $Beta | 1.13 |
| $Sharpe@@ | 1.00 |
| $Standard Deviation | 13.00% |
Initial Investment: Rs1000 and in multiple of
Rs1 for purchase and of Rs0.01 for switches
Additional Investment: Rs1000 & in
multiples of Rs1
Ideal Investments Horizon: 5 years & above
Entry Load: Nil. (applicable for all plans)
Exit Load:
a) For redemption/switch out of upto 8%
of the initial investment amount (limit)
purchased or switched in within 1 year from
the date of allotment: Nil.
b) If units redeemed or switched out are in
excess of the limit within 1 year from the
date of allotment: 1%.
c) If units are redeemed or switched out on
or after 1 year from the date of allotment:
NIL
Regular: 1.77%; Direct: 0.45%
Fund
Benchmark
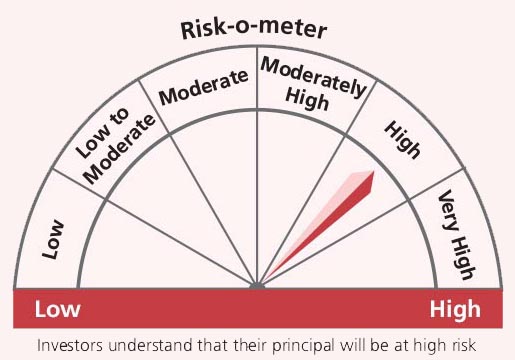
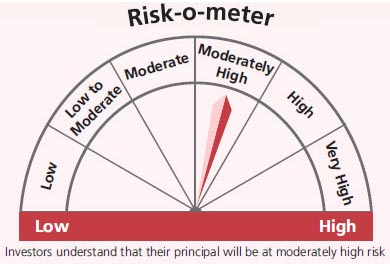
This product is suitable for investors who are seeking*:
- Wealth creation over a long period of time.
- Investment in equity, equity related securities & debt, money market instruments while managing risk through active allocation.
* Investors should consult their financial advisers if in doubt about whether the product is suitable for them.
Mr. Hiten Shah has been managing the fund since 03/10/2019.
@@Risk rate assumed to be 3.41% (FBIL Overnight MIBOR rate as on 30th November 2021).
**Total Expense Ratio includes applicable B30 fee and GST.
* For Fund Manager experience, please refer 'Our Fund Managers'
For last three IDCW, please refer 'Dividend History'.
For scheme performance, please refer 'Scheme Performances'