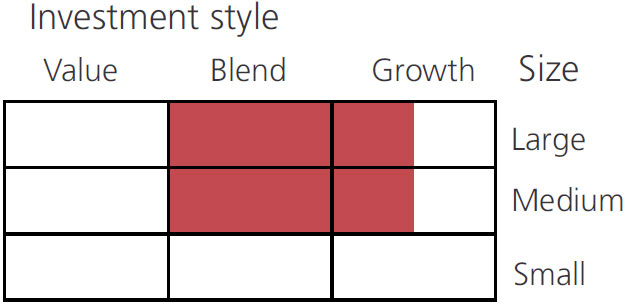
An open-ended hybrid scheme investing predominantly in equity and equity related instruments
An open-ended hybrid scheme investing predominantly in equity and equity related instruments
 |
 |
 
|
|
|
|
| Issuer/Instrument | Industry/ Rating |
% to Net Assets |
|---|---|---|
| Equity & Equity related |
||
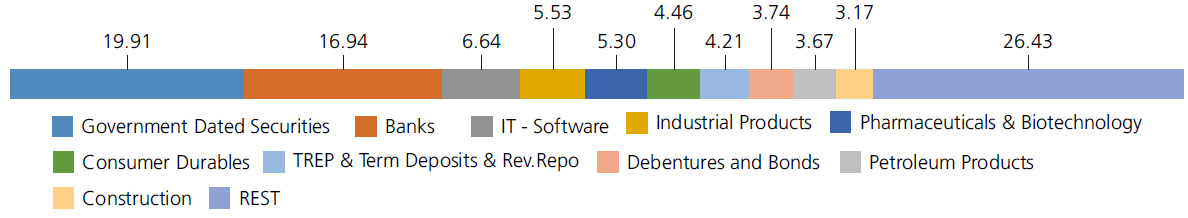
| Banks | 16.94 | |
| ICICI Bank Ltd. | 5.23 | |
| HDFC Bank Ltd. | 3.42 | |
| State Bank Of India | 3.40 | |
| Axis Bank Ltd. | 2.47 | |
| Kotak Mahindra Bank Ltd. | 1.94 | |
| AU Small Finance Bank Ltd. | 0.48 | |
| IT - Software | 6.64 | |
| Infosys Ltd. | 3.73 | |
| Tata Consultancy Services Ltd. | 1.38 | |
| Tech Mahindra Ltd. | 0.92 | |
| Oracle Financial Services Software Ltd | 0.61 | |
| Industrial Products | 5.53 | |
| Bharat Forge Ltd. | 1.55 | |
| Cummins India Ltd. | 1.43 | |
| Supreme Industries Limited | 1.28 | |
| Carborundum Universal Ltd. | 1.27 | |
| Pharmaceuticals & Biotechnology | 5.30 | |
| Sun Pharmaceuticals Industries Ltd. | 1.41 | |
| Dr Reddys Laboratories Ltd. | 0.96 | |
| Cipla Ltd. | 0.94 | |
| Torrent Pharmaceuticals Ltd. | 0.91 | |
| Ipca Laboratories Ltd. | 0.61 | |
| Zydus Lifesciences Limited | 0.47 | |
| Consumer Durables | 4.46 | |
| Century Plyboards (India) Ltd. | 1.85 | |
| Sheela Foam Ltd | 1.40 | |
| Whirlpool of India Ltd. | 0.69 | |
| Kajaria Ceramics Ltd. | 0.52 | |
| Petroleum Products | 3.67 | |
| Reliance Industries Ltd. | 2.66 | |
| Bharat Petroleum Corporation Ltd. | 0.54 | |
| Indian Oil Corporation Ltd | 0.47 | |
| Construction | 3.17 | |
| Larsen And Toubro Ltd. | 2.08 | |
| Techno Electric & Engineering Company Limited | 0.73 | |
| JMC Projects (India) Ltd. | 0.36 | |
| Chemicals & Petrochemicals | 3.05 | |
| Solar Industries India Limited | 1.96 | |
| Galaxy Surfactants Ltd. | 1.09 | |
| Cement & Cement Products | 3.00 | |
| JK Cement Ltd. | 1.20 | |
| Shree Cement Ltd. | 1.11 | |
| The Ramco Cements Ltd | 0.69 | |
| Diversified FMCG | 2.26 | |
| ITC Ltd. | 1.70 | |
| Hindustan Unilever Ltd. | 0.56 | |
| Realty | 2.03 | |
| Mahindra Lifespace Developers Ltd | 1.32 | |
| Oberoi Realty Ltd | 0.71 | |
| Automobiles | 2.23 | |
| Maruti Suzuki India Limited | 1.17 | |
| Mahindra & Mahindra Ltd. | 1.06 | |
| Electrical Equipment | 1.79 | |
| Thermax Ltd. | 1.79 | |
| Beverages | 1.76 | |
| United Spirits Ltd. | 1.76 | |
| Fertilizers & Agrochemicals | 1.28 | |
| Coromandel International Ltd. | 0.74 | |
| P I Industries Ltd | 0.54 | |
| Auto Components | 1.26 | |
| Schaeffler India Ltd | 0.75 | |
| Samvardhana Motherson International Limited | 0.51 | |
| Finance | 1.23 | |
| HDFC Ltd. | 1.23 | |
| Insurance | 1.11 | |
| ICICI Lombard General Insurance Company Ltd | 0.67 | |
| HDFC Life Insurance Company Ltd. | 0.23 | |
| Life Insurance Corporation Of India Ltd. | 0.21 | |
| Power | 1.10 | |
| National Thermal Power Corporation Limited | 1.10 | |
| Gas | 0.79 | |
| Petronet LNG Ltd. | 0.44 | |
| Gujarat Gas Ltd. | 0.35 | |
| Transport Services | 0.57 | |
| Blue Dart Express Ltd. | 0.57 | |
| Personal Products | 0.56 | |
| Emami Ltd. | 0.56 | |
| Capital Markets | 0.40 | |
| Prudent Corporate Advisory Services Ltd. | 0.40 | |
| Agricultural, Commercial & Construction Vehicles | 0.39 | |
| V.S.T Tillers Tractors Ltd | 0.39 | |
| Non - Ferrous Metals | 0.38 | |
| Hindalco Industries Ltd | 0.38 | |
| Ferrous Metals | 0.32 | |
| Shyam Metalics and Energy Ltd | 0.32 | |
| Equity & Equity related - Total | 71.22 | |
| Mutual Fund Units | ||
| Brookfield India Real Estate Trust | Realty | 0.23 |
| Mutual Fund Units - Total | 0.23 | |
| Debt Instruments | ||
| Debentures and Bonds | ||
| Corporate Debt/Financial Institutions | ||
| LIC Housing Finance Ltd. | CRISIL AAA | 0.02 |
| Corporate Debt/Financial Institutions - Total | 0.02 | |
| Public Sector Undertakings | ||
| U P Power Corporation Ltd ( Guaranteed By UP State Government ) | CRISIL A+(CE) | 1.22 |
| State Bank Of India.(Basel III TIER II Bonds) | CRISIL AAA | 0.82 |
| Small Industries Development Bank Of India ( ) | ICRA AAA | 0.64 |
| Power Finance Corporation Ltd. | CRISIL AAA | 0.38 |
| National Bank for Agriculture & Rural Development | CRISIL AAA | 0.34 |
| Power Finance Corporation Ltd. ( ) | CRISIL AAA | 0.32 |
| Public Sector Undertakings - Total | 3.72 | |
| Government Dated Securities | ||
| 7.1% Central Government | SOV | 4.49 |
| 5.74% Central Government | SOV | 4.23 |
| 7.42% Central Government(^) | SOV | 4.21 |
| 7.38% Central Government | SOV | 2.46 |
| 7.59% Karnataka State Govt-Karnataka | SOV | 0.82 |
| 6.42% Central Government | SOV | 0.81 |
| 7.91% Uttar Pradesh State Govt-Uttar Pradesh | SOV | 0.60 |
| 7.01% Central Government | SOV | 0.50 |
| 6.72% Kerala State Govt-Kerala | SOV | 0.48 |
| GS CG 22 Aug 2028 - (STRIPS) | SOV | 0.41 |
| 8.56% Maharashtra State Govt-Maharashtra | SOV | 0.20 |
| 8% Kerala State Govt-Kerala | SOV | 0.17 |
| GS CG 17 Jun 2027 - (STRIPS) | SOV | 0.16 |
| GS CG 22 Aug 2029 - (STRIPS) | SOV | 0.08 |
| GS CG 22 Feb 2030 - (STRIPS) | SOV | 0.08 |
| GS CG 22 Aug 2030 - (STRIPS) | SOV | 0.07 |
| 6.91% Rajasthan State Govt-Rajasthan | SOV | 0.03 |
| GS CG 23/12/2025 - (STRIPS) | SOV | 0.03 |
| GS CG 22 Aug 2026 - (STRIPS) | SOV | 0.02 |
| GS CG 22 Feb 2028 - (STRIPS) | SOV | 0.02 |
| GS CG 22 Feb 2029 - (STRIPS) | SOV | 0.02 |
| 7.79% Andhra Pradesh State Govt-Andhra Pradesh | SOV | 0.01 |
| GS CG 22 Feb 2027 - (STRIPS) | SOV | 0.01 |
| Government Dated Securities - Total | 19.91 | |
| Money Market Instruments | ||
| Commercial Paper(CP)/Certificate of Deposits(CD) | ||
| Corporate Debt/Financial Institutions | ||
| HDFC Bank Ltd. | FITCH IND A1+ | 0.32 |
| Corporate Debt/Financial Institutions - Total | 0.32 | |
| Triparty Repo | 4.21 | |
| Net Current Assets/(Liabilities) | 0.37 | |
| Grand Total | 100.00 | |
| | ||
Term Deposit as provided above is towards margin for derivatives transactions
| Monthly SIP of (₹) 10000 | Since Inception | 7 years | 5 years | 3 years | 1 year |
| Total amount invested (₹) | 9,60,000 | 8,40,000 | 6,00,000 | 3,60,000 | 1,20,000 |
| Total Value as on Oct 31, 2022 (₹) | 16,50,034 | 13,79,926 | 8,91,547 | 4,78,436 | 1,25,807 |
| Scheme Returns (%) | 13.20 | 13.93 | 15.84 | 19.39 | 9.11 |
| NIFTY 50 Hybrid Composite Debt 65:35 Index Returns (%) | 12.17 | 12.70 | 13.22 | 14.72 | 8.23 |
| Alpha | 1.02 | 1.23 | 2.62 | 4.67 | 0.88 |
| NIFTY 50 Hybrid Composite Debt 65:35 Index (₹)# | 15,81,493 | 13,20,538 | 8,35,823 | 4,47,845 | 1,25,253 |
| Nifty 50 (TRI) (₹)^ | 17,29,039 | 14,46,264 | 9,00,866 | 4,85,108 | 1,27,080 |
| Nifty 50 (TRI) Returns (%) | 14.32 | 15.25 | 16.27 | 20.38 | 11.14 |
Alpha is difference of scheme return with benchmark return. *All payouts during the period have been reinvested in the units of the scheme at the then prevailing NAV. Returns >= 1 year: CAGR (Compounded Annualised Growth Rate). N.A stands for data not available. Note: Point to Point (PTP) Returns in INR shows the value of 10,000/- investment made at inception. Source: ICRA MFI Explorer.
| Reg-Plan-IDCW | Rs24.407 |
| Dir-Plan-IDCW | Rs28.827 |
| Growth Option | Rs41.531 |
| Direct Growth Option | Rs47.026 |
A) Regular Plan B) Direct Plan
Options: Payout of IDCW, Reinvestment of IDCW & Growth (applicable for all plans)
| Fund Manager* | Mr. Pankaj Tibrewal, Mr. Abhishek Bisen & Mr. Arjun Khanna (Dedicated fund manager for investments in foreign securities) |
| Benchmark | NIFTY 50 Hybrid Composite Debt 65:35 Index |
| Allotment date | November 25, 1999 |
| AAUM | Rs2,977.54 crs |
| AUM | Rs3,067.33 crs |
| Folio count | 82,645 |
Half Yearly (25th of Mar/Sep)
| Portfolio Turnover | 40.38% |
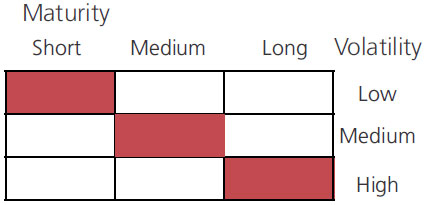
| Portfolio Average Maturity | 5.46 yrs |
| IRS Average Maturity* | 0.22 yrs |
| Net Average Maturity | 5.68 yrs |
| Portfolio Modified Duration | 2.81 yrs |
| IRS Modified Duration* | 0.20 yrs |
| Net Modified Duration | 3.01 yrs |
| Portfolio Macaulay Duration | 2.92 yrs |
| IRS Macaulay Duration* | 0.21 yrs |
| Net Macaulay Duration | 3.13 yrs |
| YTM | 7.54% |
| $Beta | 1.18 |
| $Sharpe## | 0.61 |
| $Standard Deviation | 18.15% |
Initial Investment: Rs5000 and in multiple of
Rs1 for purchase and for Rs0.01 for switches
Additional Investment: Rs1000 & in
multiples of Rs1
Ideal Investments Horizon: 5 years & above
Entry Load: Nil. (applicable for all plans)
Exit Load:
a) For redemption/switch out of upto 8%
of the initial investment amount (limit)
purchased or switched in within 1 year from
the date of allotment: Nil.
b) If units redeemed or switched out are in
excess of the limit within 1 year from the
date of allotment: 1%.
c) If units are redeemed or switched out on
or after 1 year from the date of allotment:
NIL
Regular: 2.00%; Direct: 0.59%
Fund
Benchmark
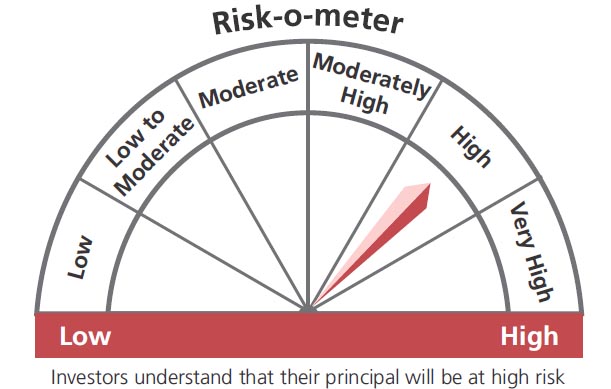
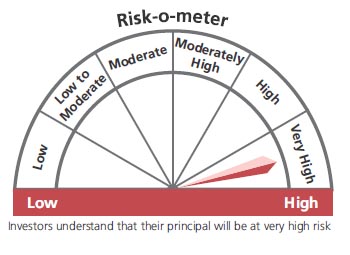
This product is suitable for investors who are seeking*:
- Long term capital growth
- Investment in equity & equity related securities balanced with income generation by investing in debt & money.
* Investors should consult their financial advisers if in doubt about whether the product is suitable for them.
(^) Fully or Party blocked against Interest Rate Swap (IRS) Hedging Position through Interest Rate Swaps as on 31 Oct 2022 is 3.25% of the net assets.
## Risk rate assumed to be 6.25% (FBIL Overnight MIBOR rate as on 31st October 2022).**Total Expense Ratio includes applicable B30 fee and GST.
* For Fund Manager experience, please refer 'Our Fund Managers'
For last three IDCW, please refer 'Dividend History'.
For scheme performance, please refer 'Scheme Performances'