Flexicap fund - An open-ended dynamic equity scheme investing across large cap, mid cap, small cap stocks
Flexicap fund - An open-ended dynamic equity scheme investing across large cap, mid cap, small cap stocks
 |
 |
 
|
|
|
|
| Issuer/Instrument | |
% to Net Assets |
|---|---|---|
| Equity & Equity related |
||
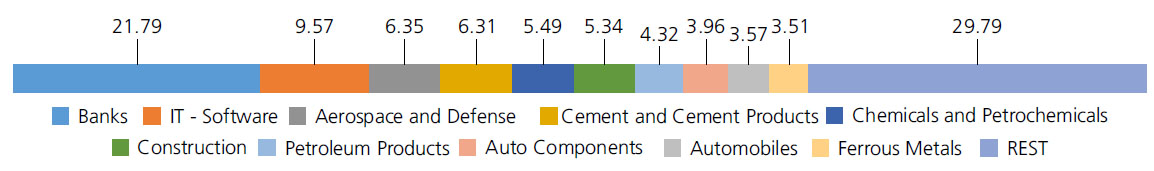
| Banks | 21.79 | |
| ICICI Bank Ltd. | 6.74 | |
| HDFC Bank Ltd. | 5.63 | |
| State Bank Of India | 3.75 | |
| Axis Bank Ltd. | 3.38 | |
| Kotak Mahindra Bank Ltd. | 1.31 | |
| AU Small Finance Bank Ltd. | 0.98 | |
| IT - Software | 9.57 | |
| Infosys Ltd. | 4.29 | |
| Tata Consultancy Services Ltd. | 2.35 | |
| HCL Technologies Ltd. | 1.48 | |
| Tech Mahindra Ltd. | 1.45 | |
| Aerospace and Defense | 6.35 | |
| Bharat Electronics Ltd. | 5.64 | |
| ZEN TECHNOLOGIES LTD | 0.71 | |
| Cement and Cement Products | 6.31 | |
| Ultratech Cement Ltd. | 3.97 | |
| The Ramco Cements Ltd | 1.51 | |
| Ambuja Cements Ltd. | 0.83 | |
| Chemicals and Petrochemicals | 5.49 | |
| SRF Ltd. | 2.77 | |
| Solar Industries India Limited | 1.94 | |
| Tata Chemicals Ltd | 0.78 | |
| Construction | 5.34 | |
| Larsen And Toubro Ltd. | 4.08 | |
| Kec International Ltd. | 1.26 | |
| Petroleum Products | 4.32 | |
| RELIANCE INDUSTRIES LTD. | 2.41 | |
| Bharat Petroleum Corporation Ltd. | 1.10 | |
| Indian Oil Corporation Ltd | 0.81 | |
| Auto Components | 3.96 | |
| Bharat Forge Ltd. | 1.70 | |
| Balkrishna Industries Ltd. | 1.10 | |
| MRF Limited | 0.85 | |
| Apollo Tyres Ltd. | 0.31 | |
| Automobiles | 3.57 | |
| Maruti Suzuki India Limited | 1.72 | |
| Hero MotoCorp Ltd. | 1.49 | |
| HYUNDAI MOTORS INDIA LTD | 0.36 | |
| Ferrous Metals | 3.51 | |
| Jindal Steel & Power Ltd. | 3.51 | |
| Pharmaceuticals and Biotechnology | 3.44 | |
| Zydus Lifesciences Limited | 2.02 | |
| Cipla Ltd. | 1.24 | |
| GlaxoSmithKline Pharmaceuticals Ltd. | 0.18 | |
| Transport Services | 3.36 | |
| Inter Globe Aviation Ltd | 2.39 | |
| Container Corporation of India Ltd. | 0.97 | |
| Retailing | 3.26 | |
| ZOMATO LTD. | 2.85 | |
| SWIGGY LTD | 0.41 | |
| Gas | 3.13 | |
| Petronet LNG Ltd. | 1.79 | |
| Indraprastha Gas Ltd. | 0.70 | |
| GAIL (India) Ltd. | 0.64 | |
| Telecom - Services | 2.70 | |
| Bharti Airtel Ltd | 2.60 | |
| Bharti Airtel Ltd - Partly Paid Shares | 0.10 | |
| Electrical Equipment | 1.80 | |
| Thermax Ltd. | 1.80 | |
| Capital Markets | 1.74 | |
| 360 ONE WAM LTD. | 0.90 | |
| BSE LTD. | 0.84 | |
| Power | 1.55 | |
| Power Grid Corporation Of India Ltd. | 1.22 | |
| TORRENT POWER LTD | 0.33 | |
| Diversified FMCG | 1.20 | |
| Hindustan Unilever Ltd. | 1.20 | |
| Non - Ferrous Metals | 0.90 | |
| Hindalco Industries Ltd | 0.90 | |
| Beverages | 0.84 | |
| United Breweries Ltd. | 0.84 | |
| Fertilizers and Agrochemicals | 0.80 | |
| Coromandel International Ltd. | 0.56 | |
| Bayer Cropscience Ltd. | 0.24 | |
| Agricultural, Commercial and Constr | 0.77 | |
| BEML Ltd. | 0.77 | |
| Industrial Products | 0.72 | |
| AIA Engineering Limited. | 0.72 | |
| Insurance | 0.60 | |
| Max Financial Services Ltd. | 0.60 | |
| Personal Products | 0.54 | |
| Godrej Consumer Products Ltd. | 0.54 | |
| Finance | 0.34 | |
| Shriram Finance Ltd. | 0.34 | |
| Equity & Equity related - Total | 97.90 | |
| Mutual Fund Units | ||
| Kotak Liquid Direct Growth | 0.12 | |
| Mutual Fund Units - Total | 0.12 | |
| Futures | ||
| Apollo Tyres Ltd.-JAN2025 | 0.27 | |
| AU Small Finance Bank Ltd.-JAN2025 | 0.02 | |
| Triparty Repo | 2.12 | |
| Net Current Assets/(Liabilities) | -0.14 | |
| Grand Total | 100.00 | |
| Monthly SIP of (₹) 10000 | Since Inception | 10 years | 7 years | 5 years | 3 years | 1 year |
| Total amount invested (₹) | 18,40,000 | 12,00,000 | 8,40,000 | 6,00,000 | 3,60,000 | 1,20,000 |
| Total Value as on Dec 31, 2024 (₹) | 68,09,402 | 26,52,850 | 15,20,446 | 9,59,294 | 4,74,038 | 1,24,073 |
| Scheme Returns (%) | 15.51 | 15.15 | 16.64 | 18.83 | 18.70 | 6.35 |
| Nifty 500 (TRI) Returns (%) | 14.92 | 16.39 | 18.41 | 20.81 | 19.51 | 6.10 |
| Alpha* | 0.60 | -1.23 | -1.77 | -1.99 | -0.81 | 0.26 |
| Nifty 500 (TRI) (₹)# | 64,56,474 | 28,34,714 | 16,19,450 | 10,06,783 | 4,79,478 | 1,23,911 |
| Nifty 200 (TRI) Returns (%) | 14.42 | 15.69 | 17.38 | 19.45 | 17.98 | 4.72 |
| Alpha* | 1.10 | -0.53 | -0.74 | -0.63 | 0.72 | 1.63 |
| Nifty 200 (TRI) (₹)# | 61,74,693 | 27,30,192 | 15,61,227 | 9,74,049 | 4,69,269 | 1,23,033 |
| Nifty 50 (TRI) (₹)^ | 56,65,018 | 25,60,790 | 14,61,571 | 9,11,372 | 4,45,453 | 1,21,600 |
| Nifty 50 (TRI) Returns (%) | 13.45 | 14.49 | 15.53 | 16.73 | 14.32 | 2.48 |
| Regular | Direct | |
| Growth | Rs79.5870 | Rs89.2460 |
| IDCW | Rs48.0580 | Rs54.5030 |
A) Regular Plan B) Direct Plan
Options: Payout of IDCW, Reinvestment of IDCW & Growth (applicable for all plans)
| Fund Manager* | Mr. Harsha Upadhyaya |
| Benchmark*** | Nifty 500 TRI (Tier 1) Nifty 200 TRI (Tier 2) |
| Allotment date | September 11, 2009 |
| AAUM | Rs 51,732.78 crs |
| AUM | Rs 50,425.90 crs |
| Folio count | 11,93,296 |
Trustee's Discretion
| Portfolio Turnover | 17.26% |
| $Beta | 0.92 |
| $Sharpe ## | 0.60 |
| $Standard Deviation | 12.86% |
| (P/E) | 24.37 |
| P/BV | 3.89 |
Initial & Additional Investment
• Rs100 and any amount thereafter
Systematic Investment Plan (SIP)
• Rs 100 and any amount thereafter
• 5 years & above
Entry Load: Nil. (applicable for all plans)
Exit Load:
• For redemption / switch out of upto 10%
of the initial investment amount (limit)
purchased or switched in within 1 year from
the date of allotment: Nil.
• If units redeemed or switched out are in
excess of the limit within 1 year from the
date of allotment: 1%
• If units are redeemed or switched out on
or after 1 year from the date of allotment:
NIL.
| Regular Plan: | 1.47% |
| Direct Plan: | 0.62% |
Folio Count data as on 30th November 2024.
Benchmark - Tier 1 : NIFTY 500 TRI
Benchmark - Tier 2 : Nifty 200 TRI
This product is suitable for investors who are seeking*:
- Long term capital growth
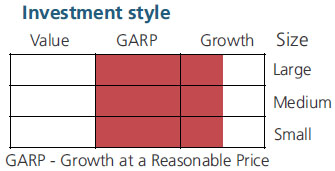
- Investment Portfolio of predominantly equity & equity related securities generally focused on a few selected sectors across market capitalisation.
* Investors should consult their financial advisors if in doubt about whether the product is suitable for them.
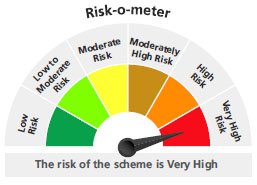
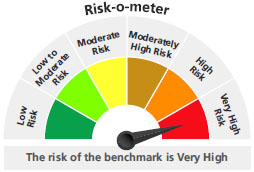
The above risk-o—meter is based on the scheme portfolio as on 30th November, 2024. An addendum may be issued or updated on the website for new riskometer.
***As per para 1.9 of of SEBI Master circular No. SEBI/HO/IMD/IMD-PoD-1/P/CIR/2024/90 dated June 27, 2024 The first tier benchmark is reflective of the category of the scheme and the second tier benchmark is demonstrative of the investment style / strategy of the Fund Manager within the category.
## Risk rate assumed to be 7.15% (FBIL Overnight MIBOR rate as on 31st Dec 2024).**Total Expense Ratio includes applicable B30 fee and GST.
* For Fund Manager experience, please refer 'For Regular Plan' & 'For Direct Plan'
For last three IDCW, please refer 'Dividend History'.
For scheme performance, please refer 'For Regular Plan' & 'For Direct Plan'