| KOTAK BSE PSU INDEX FUND
An open-ended scheme replicating/tracking BSE PSU Index
An open-ended scheme replicating/tracking BSE PSU Index
| KOTAK BSE PSU INDEX FUND
An open-ended scheme replicating/tracking BSE PSU Index
An open-ended scheme replicating/tracking BSE PSU Index
 |
 |
 
|
|
|
|
Investment Objective
The investment objective of the scheme is to provide returns that, before expenses, corresponding to the total returns of the securities as represented by the
underlying index, subject to tracking errors. However, there is no assurance that the objective of the scheme will be achieved.
The investment objective of the scheme is to provide returns that, before expenses, corresponding to the total returns of the securities as represented by the
underlying index, subject to tracking errors. However, there is no assurance that the objective of the scheme will be achieved.
| Issuer/Instrument | |
% to Net Assets |
|---|---|---|
| Equity & Equity Related | ||
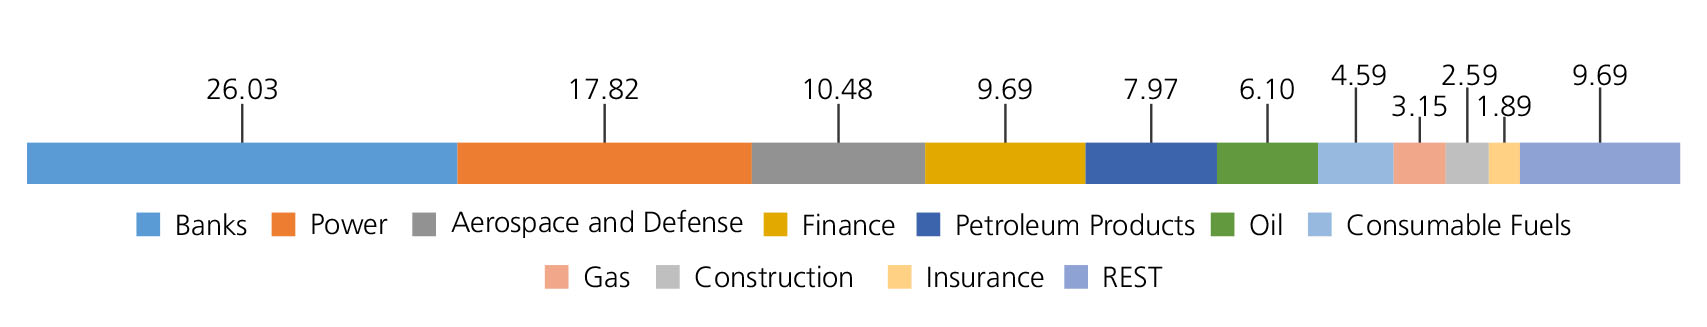
| Banks | 26.03 | |
| State Bank Of India | 16.01 | |
| Bank Of Baroda | 2.35 | |
| PUNJAB NATIONAL BANK | 1.86 | |
| CANARA BANK | 1.76 | |
| UNION BANK OF INDIA | 1.21 | |
| INDIAN BANK | 0.98 | |
| BANK OF INDIA | 0.66 | |
| BANK OF MAHARASHTRA | 0.42 | |
| JAMMU AND KASHMIR BANK LTD. | 0.23 | |
| Indian Overseas Bank | 0.21 | |
| Central Bank Of India | 0.17 | |
| UCO Bank | 0.14 | |
| Punjab & Sind Bank | 0.03 | |
| Power | 17.82 | |
| NTPC LTD | 8.31 | |
| Power Grid Corporation Of India Ltd. | 7.38 | |
| NHPC LIMITED | 1.32 | |
| NLC India Ltd. | 0.42 | |
| SJVN LIMITED | 0.39 | |
| Aerospace and Defense | 10.48 | |
| Bharat Electronics Ltd. | 5.51 | |
| HINDUSTAN AERONAUTICS LTD. | 4.10 | |
| BHARAT DYNAMICS LTD | 0.54 | |
| GARDEN REACH SHIPBUILDERS & ENGINEERS LTD | 0.24 | |
| MISHRA DHATU NIGAM LTD | 0.09 | |
| Finance | 9.69 | |
| Power Finance Corporation Ltd. | 3.42 | |
| REC LTD | 3.25 | |
| INDIAN RAILWAY FINANCE CORPORATION LTD. | 1.43 | |
| INDIAN RENEWABLE ENERGY DEVELOPMENT AGENCY LTD. | 0.76 | |
| HOUSING & URBAN DEVELOPMENT CORPORATION LTD. | 0.62 | |
| IFCI Ltd. | 0.21 | |
| Petroleum Products | 7.97 | |
| Bharat Petroleum Corporation Ltd. | 2.99 | |
| Indian Oil Corporation Ltd | 2.63 | |
| HINDUSTAN PETROLEUM CORPORATION LTD | 2.05 | |
| Chennai Petroleum Corporation Ltd. | 0.16 | |
| Mangalore Refinery And Petrochemicals Ltd. | 0.14 | |
| Oil | 6.10 | |
| Oil & Natural Gas Corporation Ltd. | 4.89 | |
| OIL INDIA LIMITED | 1.21 | |
| Consumable Fuels | 4.59 | |
| Coal India Ltd. | 4.59 | |
| Gas | 3.15 | |
| GAIL (India) Ltd. | 2.70 | |
| Gujarat Gas Ltd. | 0.45 | |
| Construction | 2.59 | |
| Rail Vikas Nigam Limited. | 1.25 | |
| NBCC (India) Ltd | 0.50 | |
| Ircon International Ltd | 0.37 | |
| Engineers India Ltd. | 0.26 | |
| RITES Ltd. | 0.21 | |
| Insurance | 1.89 | |
| LIFE INSURANCE CORPORATION OF INDIA LTD. | 0.89 | |
| General Insurance Corporation Of India | 0.74 | |
| THE NEW INDIA ASSURANCE COMPANY LTD | 0.26 | |
| Electrical Equipment | 1.55 | |
| Bharat Heavy Electricals Ltd. | 1.55 | |
| Non - Ferrous Metals | 1.43 | |
| National Aluminium Company Ltd | 1.00 | |
| HINDUSTAN COPPER LTD. | 0.43 | |
| Minerals and Mining | 1.33 | |
| NMDC Ltd. | 1.19 | |
| Gujarat Mineral Development Corporation Ltd. | 0.14 | |
| Industrial Manufacturing | 1.28 | |
| MAZAGOAN DOCK SHIPBUILDERS LTD | 0.71 | |
| COCHIN SHIPYARD LTD. | 0.57 | |
| Leisure Services | 1.25 | |
| Indian Railway Catering And Tourism Corporation Ltd. | 1.25 | |
| Ferrous Metals | 1.13 | |
| Steel Authority of India Ltd. | 0.86 | |
| NMDC STEEL LTD | 0.26 | |
| KIOCL LTD | 0.01 | |
| Transport Services | 1.13 | |
| Container Corporation of India Ltd. | 1.13 | |
| Agricultural, Commercial and Construction Vehicles | 0.41 | |
| BEML Ltd. | 0.41 | |
| Telecom - Equipment and Accessorie | 0.20 | |
| ITI LTD | 0.20 | |
| Fertilizers and Agrochemicals | 0.13 | |
| RASHTRIYA CHEMICALS & FERTILIZERS LTD | 0.13 | |
| Commercial Services and Supplies | 0.06 | |
| MMTC LTD | 0.06 | |
| Equity & Equity related - Total | 100.21 | |
| Triparty Repo | 0.43 | |
| Net Current Assets/(Liabilities) | -0.64 | |
| Grand Total | 100.00 | |
Net Asset Value (NAV)
| Regular | Direct | |
| Growth | Rs8.3200 | Rs8.3430 |
| IDCW | Rs8.3200 | Rs8.3430 |
Available Plans/Options
A) Regular Plan B) Direct Plan
Options: Payout of IDCW, Reinvestment of
IDCW & Growth (applicable for all plans)
| Fund Manager* | Mr. Devender Singhal, Mr. Satish Dondapati, Mr. Abhishek Bisen |
| Benchmark | BSE PSU Index TRI |
| AAUM | Rs72.52 crs |
| AUM | Rs70.34 crs |
| Allotment date | July 31, 2024 |
| Folio count | 21,908 |
IDCW Frequency
Trustee's Discretion
Ratios
| Portfolio Turnover : | 8.39% |
| Tracking Error: | 0.18% |
Minimum Investment Amount
Initial & Additional Investment
• Rs100 and any amount thereafter
Systematic Investment Plan (SIP)
• Rs 100 and any amount thereafter
Ideal Investments Horizon
• 5 years & above
Load Structure
Entry Load: Nil. (applicable for all plans)
Exit Load:
Nil.
Total Expense Ratio**
| Regular Plan: | 1.05% |
| Direct Plan: | 0.38% |
Data as on 31st December, 2024 unless
otherwise specified.
Folio Count data as on 30th November 2024.
Folio Count data as on 30th November 2024.
Fund
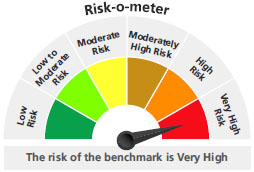
Benchmark : BSE PSU Index TRI
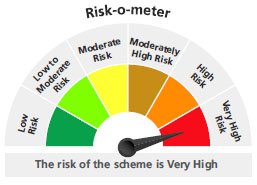
This product is suitable for investors who are seeking*:
- Long term capital growth
- Return that corresponds to the performance of BSE PSU Index subject to tracking error.
* Investors should consult their financial advisors if in doubt about whether the product is suitable for them.
The above risk-o—meter is based on the scheme portfolio as on 30th November, 2024. An addendum may be issued or updated on the website for new riskometer.
* For Fund Manager experience, please refer 'For Regular Plan' & 'For Direct Plan'
Total Expense Ratio includes applicable B30 fee and GST
The scheme has not completed 6 month since inception