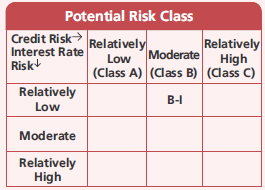
An open ended debt scheme investing in money market instruments. A relatively low interest rate risk and moderate credit risk.
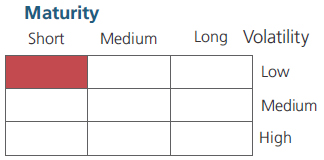
An open ended debt scheme investing in money market instruments. A relatively low interest rate risk and moderate credit risk.
 |
 |
 
|
|
|
|
| Issuer/Instrument | Industry/Rating | % to Net Assets |
|---|---|---|
| Government Dated Securities | ||
| 5.22% Central Government | SOV | 1.30 |
| 5.80% Maharashtra State Govt-Maharashtra | SOV | 0.93 |
| 8.29% Maharashtra State Govt-Maharashtra | SOV | 0.78 |
| 8.23% Gujarat State Govt-Gujarat | SOV | 0.75 |
| 8.24% Tamil Nadu State Govt-Tamil Nadu | SOV | 0.72 |
| 8.06% Maharashtra State Govt-Maharashtra | SOV | 0.47 |
| 8.59% Karnataka State Govt-Karnataka | SOV | 0.40 |
| 8.05% Karnataka State Govt-Karnataka | SOV | 0.32 |
| 8.05% Gujarat State Govt-Gujarat | SOV | 0.28 |
| 8.15% Gujarat State Govt-Gujarat | SOV | 0.27 |
| 8.21% Haryana State Govt-Haryana | SOV | 0.25 |
| 7.96% Gujarat State Govt-Gujarat | SOV | 0.19 |
| 8.07% Gujarat State Govt-Gujarat | SOV | 0.19 |
| 8.27% Madhya Pradesh State Govt-Madhya Pradesh | SOV | 0.18 |
| 6.90% Tamil Nadu State Govt-Tamil Nadu | SOV | 0.13 |
| 8.16% Maharashtra State Govt-Maharashtra | SOV | 0.06 |
| 8.29% Tamil Nadu State Govt-Tamil Nadu | SOV | 0.02 |
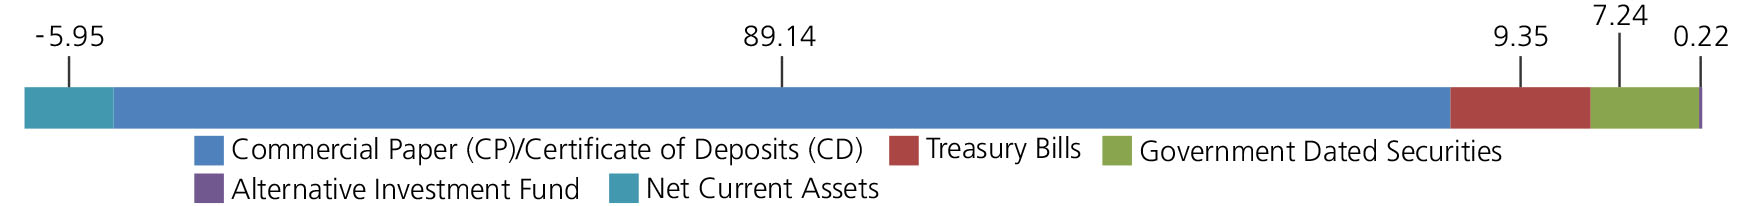
| Government Dated Securities - Total | 7.24 | |
| Money Market Instruments | ||
| Commercial Paper(CP)/Certificate of Deposits(CD) | ||
| Corporate Debt/Financial Institutions | ||
| HDFC BANK LTD. | CARE A1+ | 9.69 |
| AXIS BANK LTD. | CRISIL A1+ | 6.45 |
| INDUSIND BANK LTD. | CRISIL A1+ | 4.18 |
| FEDERAL BANK LTD. | CRISIL A1+ | 3.98 |
| BHARTI TELECOM LTD. | CRISIL A1+ | 2.46 |
| ICICI SECURITIES LIMITED | CRISIL A1+ | 2.32 |
| PIRAMAL CAPITAL & HOUSING FINANCE LTD. | CRISIL A1+ | 2.22 |
| STANDARD CHARTERED CAPITAL LTD. | CRISIL A1+ | 1.58 |
| MUTHOOT FINANCE LTD. | CRISIL A1+ | 1.57 |
| SHAREKHAN LIMITED | CRISIL A1+ | 1.42 |
| MANKIND PHARMA LTD | CRISIL A1+ | 1.39 |
| DBS BANK INDIA | FITCH A1+ | 1.11 |
| MOTILAL OSWAL FINANCIAL SERVICES LIMITED | ICRA A1+ | 1.11 |
| ICICI BANK LTD. | ICRA A1+ | 1.05 |
| AXIS SECURITIES LIMITED | CRISIL A1+ | 0.92 |
| IDFC FIRST BANK LIMITED | CRISIL A1+ | 0.92 |
| RBL BANK LTD. | ICRA A1+ | 0.92 |
| ADITYA BIRLA FINANCE LTD. | ICRA A1+ | 0.90 |
| Hero FinCorp Ltd. | CRISIL A1+ | 0.87 |
| BIRLA GROUP HOLDING PRIVATE LIMITED | CRISIL A1+ | 0.74 |
| HDFC CREDILA FINANCIAL SERVICES PVT LTD | CRISIL A1+ | 0.74 |
| TATA CAPITAL HOUSING FINANCE LTD. | CRISIL A1+ | 0.74 |
| TATA MOTORS FINANCE LTD. | ICRA A1+ | 0.74 |
| Muthoot Fincorp Ltd. | CRISIL A1+ | 0.72 |
| BARCLAYS INVESTMENTS & LOAN (INDIA) PVT. LTD. | CRISIL A1+ | 0.56 |
| IIFL FINANCE LIMITED | CRISIL A1+ | 0.55 |
| Bahadur Chand Investments Private Limited | ICRA A1+ | 0.38 |
| 360 ONE WAM LIMITED | ICRA A1+ | 0.37 |
| AU SMALL FINANCE BANK LTD. | CARE A1+ | 0.37 |
| GODREJ FINANCE LTD | CRISIL A1+ | 0.37 |
| HINDUJA LEYLAND FINANCE LTD. | CRISIL A1+ | 0.37 |
| NUVAMA WEALTH FINANCE LIMITED | CRISIL A1+ | 0.37 |
| HDFC BANK LTD. | FITCH A1+ | 0.28 |
| MOTILAL OSWAL FINVEST LTD. | CRISIL A1+ | 0.28 |
| NUVAMA WEALTH MANAGEMENT LIMITED | CRISIL A1+ | 0.19 |
| PILANI INVESTMENT AND INDUSTRIES CORPORATION LTD | CRISIL A1+ | 0.19 |
| AU SMALL FINANCE BANK LTD. | CRISIL A1+ | 0.18 |
| NUVAMA WEALTH AND INVESTMENT LTD | CRISIL A1+ | 0.18 |
| Panatone Finvest Ltd. | CRISIL A1+ | 0.09 |
| Corporate Debt/Financial Institutions - Total | 53.47 | |
| Public Sector Undertakings | ||
| SMALL INDUSTRIES DEVELOPMENT BANK OF INDIA | CARE A1+ | 7.61 |
| BANK OF BARODA | FITCH A1+ | 4.90 |
| NATIONAL BANK FOR AGRICULTURE & RURAL DEVELOPMENT | CRISIL A1+ | 4.58 |
| INDIAN BANK | CRISIL A1+ | 4.08 |
| Union Bank of India | FITCH A1+ | 4.06 |
| PUNJAB NATIONAL BANK | FITCH A1+ | 3.59 |
| PUNJAB NATIONAL BANK | ICRA A1+ | 2.04 |
| CANARA BANK | CRISIL A1+ | 1.35 |
| Union Bank of India | ICRA A1+ | 0.92 |
| PUNJAB NATIONAL BANK | CARE A1+ | 0.87 |
| BANK OF INDIA | CRISIL A1+ | 0.74 |
| PUNJAB & SIND BANK | ICRA A1+ | 0.74 |
| Export-Import Bank of India | CRISIL A1+ | 0.19 |
| Public Sector Undertakings - Total | 35.67 | |
| Treasury Bills | ||
| 182 DAYS TREASURY BILL 01/05/2025 | SOV | 1.92 |
| 182 DAYS TREASURY BILL 06/03/2025 | SOV | 1.85 |
| 182 DAYS TREASURY BILL 15/05/2025 | SOV | 1.83 |
| 364 DAYS TREASURY BILL 04/12/2025 | SOV | 1.41 |
| 182 DAYS TREASURY BILL 08/05/2025 | SOV | 0.73 |
| 364 DAYS TREASURY BILL 06/11/2025 | SOV | 0.71 |
| 182 DAYS TREASURY BILL 27/02/2025 | SOV | 0.37 |
| 364 DAYS TREASURY BILL 21/11/2025 | SOV | 0.34 |
| 364 DAYS TREASURY BILL 20/02/2025 | SOV | 0.19 |
| Treasury Bills - Total | 9.35 | |
| Alternative Investment Fund | ||
| CORPORATE DEBT MARKET DEVELOPMENT FUND - CLASS A2 | Alternative Investment Fund | 0.22 |
| Alternative Investment Fund - Total | 0.22 | |
| Net Current Assets/(Liabilities) | -5.95 | |
| Grand Total | 100.00 | |

| Monthly SIP of (₹) 10000 | Since Inception | 10 years | 7 years | 5 years | 3 years | 1 year |
| Total amount invested (₹) | 25,80,000 | 12,00,000 | 8,40,000 | 6,00,000 | 3,60,000 | 1,20,000 |
| Total Value as on December 31, 2024 (₹) | 59,39,654 | 16,69,814 | 10,50,102 | 7,04,886 | 4,01,680 | 1,24,795 |
| Scheme Returns (%) | 7.13 | 6.43 | 6.28 | 6.38 | 7.24 | 7.49 |
| CRISIL Money Market A-I Index Returns (%) | 6.99 | 6.30 | 6.17 | 6.33 | 7.16 | 7.25 |
| Alpha* | 0.15 | 0.13 | 0.11 | 0.05 | 0.08 | 0.24 |
| CRISIL Money Market A-I Index (₹)# | 58,33,080 | 16,58,373 | 10,45,935 | 7,04,000 | 4,01,178 | 1,24,645 |
| NIFTY 1 Year T-Bill Index (₹)^ | 54,97,346 | 16,38,917 | 10,34,770 | 6,95,475 | 3,97,815 | 1,24,412 |
| NIFTY 1 Year T-Bill Index Returns (%) | 6.51 | 6.07 | 5.87 | 5.84 | 6.59 | 6.88 |
| Regular | Direct | |
| Growth | Rs4318.3411 | Rs4355.7147 |
| Monthly IDCW | Rs1054.1513 | Rs1193.3302 |
A)Regular Plan B)Direct Plan
Options: Payout of IDCW (Under Monthly
IDCW option only), Reinvestment of IDCW
& Growth applicable for all plans
| Fund Manager* | Mr. Deepak Agrawal, Mr. Manu Sharma |
| Benchmark*** | CRISIL Money Market A-I Index |
| Allotment date | July 14, 2003 |
| AAUM | Rs29,191.72 crs |
| AUM | Rs26,727.60 crs |
| Folio count | 15,322 |
Monthly (12th of every Month)
| Average Maturity | 0.46 yrs |
| Modified Duration | 0.46 yrs |
| Macaulay Duration | 0.46 yrs |
| Annualised YTM* | 7.51% |
| $Standard Deviation | 0.21% |
Source: $ICRA MFI Explorer.
Initial & Additional Investment
• Rs100 and any amount thereafter
Systematic Investment Plan (SIP)
• Rs 100 and any amount thereafter
• 3-6 months
Entry Load:
Nil. (applicable for all plans)
Exit Load:
Nil. (applicable for all plans)
| Regular Plan: | 0.35% |
| Direct Plan: | 0.23% |
Folio Count data as on 30th November 2024.
Fund
Benchmark: CRISIL Money Market A-I Index
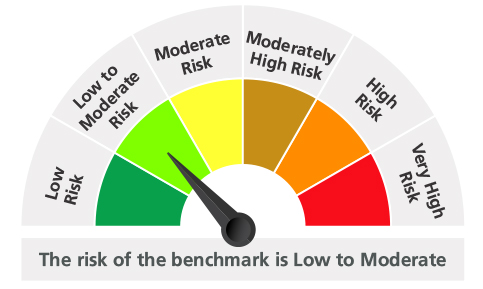
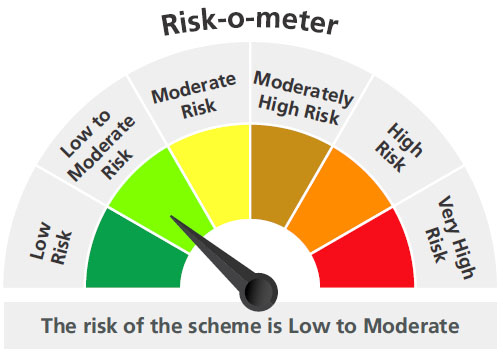
This product is suitable for investors who are seeking*:
- Income over a short term investment horizon
- Investment in money market securities
* Investors should consult their financial advisors if in doubt about whether the product is suitable for them.
The above risk-o—meter is based on the scheme portfolio as on 30th November, 2024. An addendum may be issued or updated on the website for new riskometer
* For Fund Manager experience, please refer 'For Regular Plan' & 'For Direct Plan'
For last three IDCW, please refer 'Dividend History'.
For scheme performance, please refer 'For Regular Plan' & 'For Direct Plan'