An open ended equity Scheme following contrarian investment strategy
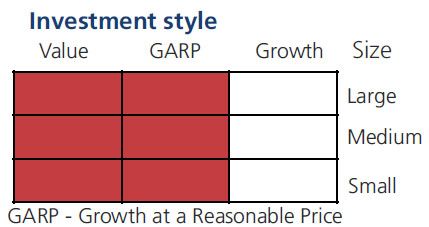
An open ended equity Scheme following contrarian investment strategy
 |
 |
  
|
|
|
|
| Issuer/Instrument | % to Net Assets |
|
|---|---|---|
| Equity & Equity related | ||
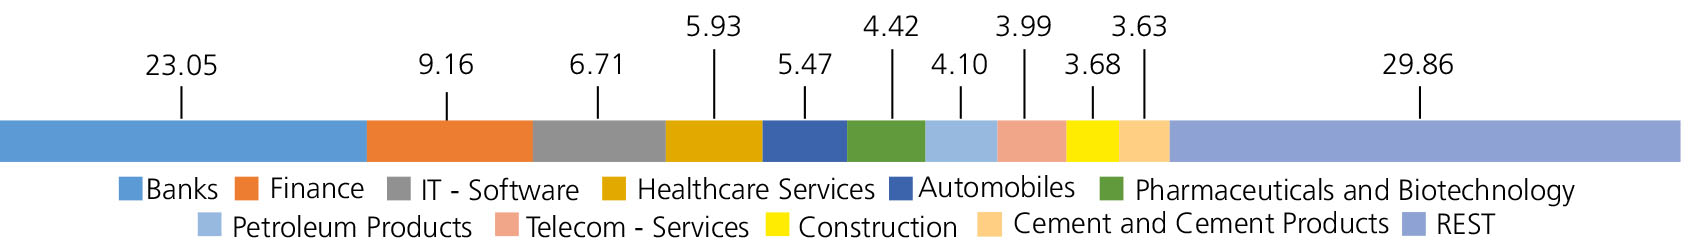
| Banks | 23.05 | |
| HDFC Bank Ltd. | 5.82 | |
| ICICI Bank Ltd. | 4.61 | |
| STATE BANK OF INDIA | 4.18 | |
| Axis Bank Ltd. | 2.02 | |
| Bank Of Baroda | 1.61 | |
| IndusInd Bank Ltd. | 1.51 | |
| INDIAN BANK | 1.40 | |
| BANK OF MAHARASHTRA | 1.32 | |
| KOTAK MAHINDRA BANK LTD. | 0.58 | |
| Finance | 9.16 | |
| SHRIRAM FINANCE LTD. | 3.26 | |
| POONAWALLA FINCORP LTD. | 2.13 | |
| BAJAJ FINANCE LTD. | 2.06 | |
| APTUS VALUE HOUSING FINANCE | 0.87 | |
| PIRAMAL FINANCE LTD | 0.84 | |
| IT - Software | 6.71 | |
| Infosys Ltd. | 2.82 | |
| Mphasis Ltd | 1.99 | |
| Tech Mahindra Ltd. | 1.90 | |
| Healthcare Services | 5.93 | |
| Fortis Healthcare India Ltd | 2.41 | |
| PARK MEDI WORLD LIMITED (PARK HOSPITAL) | 1.46 | |
| Global Health Ltd. | 1.10 | |
| Metropolis Healthcare Ltd. | 0.96 | |
| Automobiles | 5.47 | |
| Hero MotoCorp Ltd. | 2.89 | |
| Maruti Suzuki India Limited | 2.58 | |
| Pharmaceuticals and Biotechnology | 4.42 | |
| Ipca Laboratories Ltd. | 1.49 | |
| JB CHEMICALS & PHARMACEUTICALS LTD. | 0.99 | |
| Ajanta Pharma Ltd. | 0.98 | |
| JUBILANT PHARMOVA LIMITED | 0.96 | |
| Petroleum Products | 4.10 | |
| RELIANCE INDUSTRIES LTD. | 3.02 | |
| Bharat Petroleum Corporation Ltd. | 1.08 | |
| Telecom - Services | 3.99 | |
| Bharti Airtel Ltd | 2.58 | |
| Indus Towers Ltd. | 1.41 | |
| Construction | 3.68 | |
| Larsen And Toubro Ltd. | 2.62 | |
| KALPATARU PROJECTS INTERNATIONAL LIMITED | 1.06 | |
| Cement and Cement Products | 3.63 | |
| Ultratech Cement Ltd. | 2.13 | |
| Dalmia Bharat Limited | 1.50 | |
| Consumer Durables | 3.13 | |
| VOLTAS LTD. | 1.17 | |
| Century Plyboards (India) Ltd. | 1.12 | |
| LG ELECTRONICS INDIA LTD | 0.84 | |
| Power | 2.62 | |
| NTPC LTD | 2.62 | |
| Ferrous Metals | 2.50 | |
| Jindal Steel & Power Ltd. | 1.51 | |
| Tata Steel Ltd. | 0.99 | |
| Retailing | 2.43 | |
| SWIGGY LTD | 1.85 | |
| VISHAL MEGA MART LIMITED | 0.58 | |
| Electrical Equipment | 2.37 | |
| GE VERNOVA T&D INDIA LIMITED | 2.14 | |
| EMMVEE PHOTOVOLTAIC POWER LIMITED | 0.23 | |
| Aerospace and Defense | 1.71 | |
| Bharat Electronics Ltd. | 1.71 | |
| Agricultural, Commercial and Construction Vehicles | 1.51 | |
| ASHOK LEYLAND LTD. | 1.51 | |
| Personal Products | 1.35 | |
| Godrej Consumer Products Ltd. | 1.35 | |
| Chemicals and Petrochemicals | 1.34 | |
| SRF Ltd. | 1.34 | |
| Transport Services | 1.27 | |
| Inter Globe Aviation Ltd | 1.27 | |
| Beverages | 1.11 | |
| Radico Khaitan Ltd. | 1.11 | |
| Non - Ferrous Metals | 1.05 | |
| Hindalco Industries Ltd | 1.05 | |
| Insurance | 1.01 | |
| SBI Life Insurance Company Ltd | 1.01 | |
| Capital Markets | 0.81 | |
| NUVAMA WEALTH MANAGEMENT LIMITED | 0.81 | |
| Diversified FMCG | 0.80 | |
| ITC Ltd. | 0.80 | |
| Fertilizers and Agrochemicals | 0.77 | |
| Coromandel International Ltd. | 0.77 | |
| Industrial Products | 0.64 | |
| HAPPY FORGINGS LTD | 0.64 | |
| Leisure Services | 0.63 | |
| SAPPHIRE FOODS INDIA LTD. | 0.63 | |
| Industrial Manufacturing | 0.59 | |
| JYOTI CNC AUTOMATION LTD | 0.59 | |
| Auto Components | 0.57 | |
| TENNECO CLEAN AIR INDIA LIMITED | 0.57 | |
| Equity & Equity related - Total | 98.35 | |
| Triparty Repo | 1.70 | |
| Net Current Assets/(Liabilities) | -0.05 | |
| Grand Total | 100.00 | |
| | ||
| Monthly SIP of (₹) 10000 | Since Inception | 10 years | 7 years | 5 years | 3 years | 1 year |
| Total amount invested (₹) | 24,80,000 | 12,00,000 | 8,40,000 | 6,00,000 | 3,60,000 | 1,20,000 |
| Total Value as on Feb 27, 2026 (₹) | 1,38,01,328 | 29,39,263 | 16,26,311 | 9,06,572 | 4,43,194 | 1,26,771 |
| Scheme Returns (%) | 14.54 | 17.08 | 18.57 | 16.57 | 14.05 | 10.78 |
| Nifty 500 (TRI) Returns (%) | 13.27 | 14.66 | 15.57 | 12.71 | 10.47 | 5.49 |
| Alpha* | 1.26 | 2.42 | 3.00 | 3.86 | 3.58 | 5.30 |
| Nifty 500 (TRI) (₹)# | 1,17,45,656 | 25,80,417 | 14,61,798 | 8,24,631 | 4,20,897 | 1,23,472 |
| Nifty 100 (TRI) Returns (%) | 12.86 | 13.58 | 13.97 | 11.49 | 9.98 | 5.68 |
| Alpha* | 1.68 | 3.50 | 4.60 | 5.07 | 4.07 | 5.11 |
| Nifty 100 (TRI) (Rs)# | 1,11,46,902 | 24,35,591 | 13,80,795 | 8,00,231 | 4,17,891 | 1,23,591 |
| Nifty 50 (TRI) (Rs)^ | 1,06,63,701 | 24,21,985 | 13,64,474 | 7,91,192 | 4,13,672 | 1,22,960 |
| Nifty 50 (TRI) Returns (%) | 12.51 | 13.47 | 13.64 | 11.04 | 9.28 | 4.67 |
| Regular | Direct | |
| Growth | Rs155.1026 | Rs184.3472 |
| IDCW | Rs53.4633 | Rs65.5997 |
A) Regular Plan B) Direct Plan
Options: Payout of IDCW, Reinvestment of
IDCW & Growth (applicable for all plans)
| Fund Manager* | Ms. Shibani Sircar Kurian |
| Benchmark*** | Nifty 500 TRI (Tier 1), Nifty 100 TRI (Tier 2) |
| Allotment date | July 27, 2005 |
| AAUM | Rs5,206.61 crs |
| AUM | Rs5,224.68 crs |
| Folio count | 1,41,666 |
Trustee's Discretion
| Portfolio Turnover | 34.24% |
| $Beta | 1.00 |
| $Sharpe ## | 1.19 |
| $Standard Deviation | 13.04% |
| ^^(P/E) | 26.61 |
| ^^P/BV | 3.44 |
| Large Cap | 57.40% |
| Mid Cap | 29.08% |
| Small Cap | 11.87% |
| Debt & Money Market | 1.65% |
*% of Net Asset
Initial & Additional Investment
• Rs100 and any amount thereafter
Systematic Investment Plan (SIP)
• Rs 100 and any amount thereafter
• 5 years & above
Entry Load:
Nil. (applicable for all plans)
Exit Load:
• For redemption / switch out within 90
days from the date of allotment:1%
• If units are redeemed or switched out on
or after 90 days from the date of allotment -
Nil.
| Regular Plan: | 1.83% |
| Direct Plan: | 0.58% |
Folio Count data as on 31st January 2026.
Benchmark - Tier 1 : Nifty 500 TRI
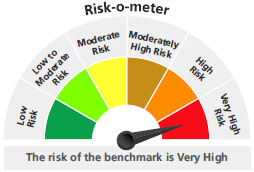
Benchmark - Tier 2 : Nifty 100 TRI
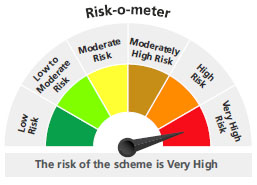
This product is suitable for investors who are seeking*:
- Long term capital growth
- Investment in portfolio of predominantly equity & equity related securities.
* Investors should consult their financial advisors if in doubt about whether the product is suitable for them.
For latest Riskometer, investors may refer to an addendum issued or updated on website at www.kotakmf.com
***As per para 1.9 of of SEBI Master c***As per para 1.9 of of SEBI Master circular No. SEBI/HO/IMD/IMD-PoD-1/P/CIR/2024/90 dated June 27, 2024 The first tier benchmark is reflective of the category of the scheme and the second tier benchmark is demonstrative of the investment style / strategy of the Fund Manager within the category.
## Risk rate assumed to be 5.17% (FBIL Overnight MIBOR rate as on 27th Feb 2026).**Total Expense Ratio includes applicable B30 fee and GST.
* For Fund Manager experience, please refer 'For Regular Plan' & 'For Direct Plan'
For last three IDCW, please refer 'Dividend History'.
For scheme performance, please refer 'For Regular Plan' & 'For Direct Plan'