 
|
|
|
Key Events for the Month of October 2025
• India’s Services Purchasing Managers' Index (PMI) eased in September to 60.9, slightly lower than August’s
recent high of 62.9.
• India’s Manufacturing Purchasing Managers’ Index (PMI) showed renewed strength in October, rising to a two-month
high of 58.4 from 57.7 in September. The manufacturing sector continued to expand at a solid pace,
supported by strong domestic demand and easing cost pressures.
• India’s Consumer Price Inflation (CPI) declined to an eight-year low of 1.54% in September, mainly due to a fall in
prices of vegetables, edible oils, fruits, pulses, cereals, and eggs. Fuel prices also turned cheaper during the month.
• India’s Wholesale Price Index (WPI)-based inflation eased to 0.13% in September from 0.52% in August,
driven largely by falling food and fuel prices.
• India’s GST collections rose 4.6% year-on-year to 1.96 lakh crore in October.
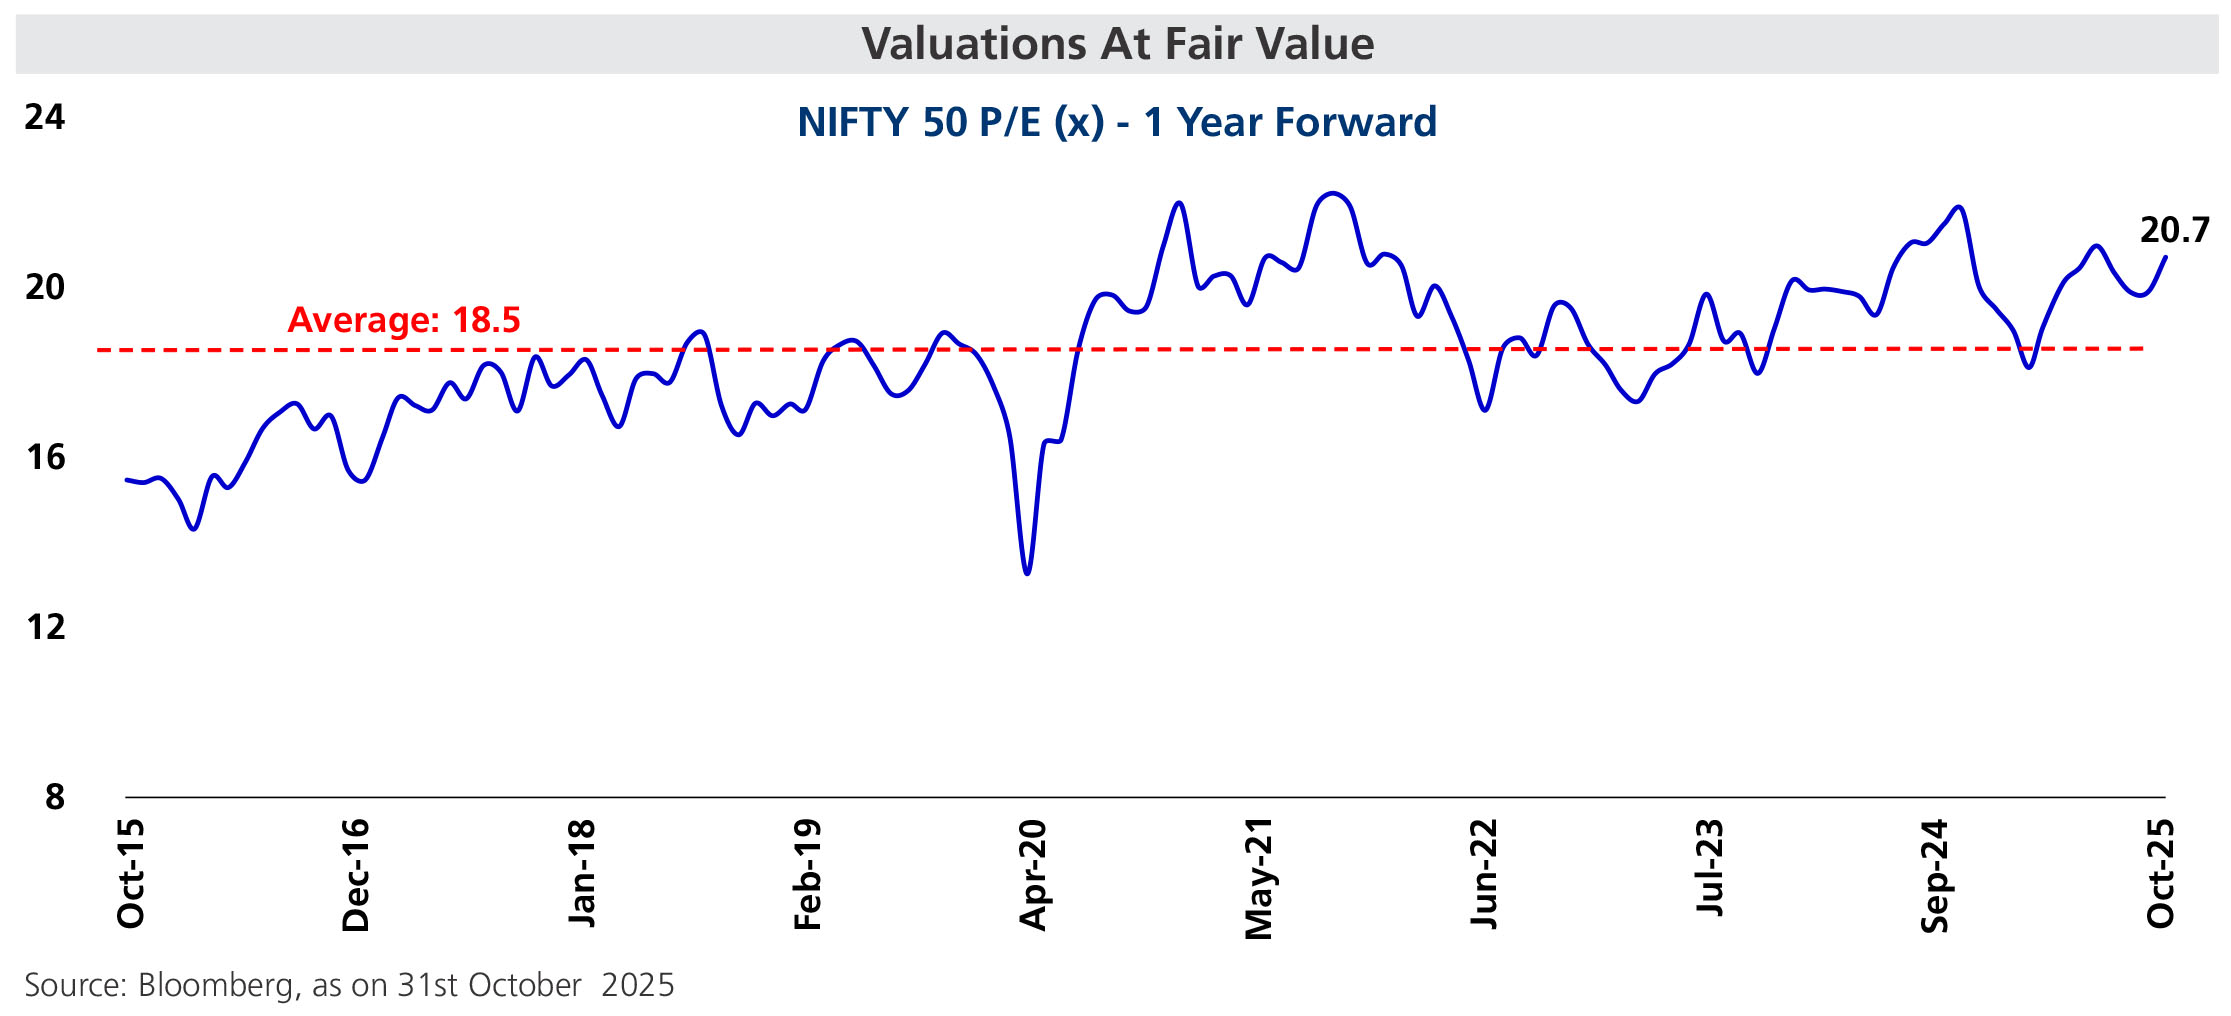
• Equity markets registered strong gains in October 2025, with the Nifty 50 advancing by 4.5% and the BSE Sensex
climbing 4.6%, supported by positive domestic and global cues.
| |
Sectoral Index Performance |
| Name | 3 Months | 6 Months | 1 Year | 3 Years | 5 Years |
| Nifty Auto Index | 13.3% | 20.2% | 14.0% | 26.0% | 28.1% |
| Nifty Bank Index | 3.2% | 4.9% | 12.2% | 11.8% | 19.3% |
| Nifty Energy Index | 3.3% | 5.9% | -7.7% | 10.8% | 19.3% |
| Nifty Financial Services Index | 1.8% | 3.9% | 13.6% | 13.5% | 18.4% |
| Nifty FMCG Index | 0.7% | -0.4% | -5.1% | 8.3% | 13.8% |
| Nifty Healthcare Index | -1.3% | 4.6% | 1.8% | 20.5% | 21.4% |
| Nifty Infrastructure Index | 5.5% | 8.9% | 8.4% | 22.2% | 25.0% |
| Nifty IT Index | 1.2% | -0.2% | -11.6% | 7.5% | 11.3% |
| Nifty Media Index | -5.4% | 1.6% | -23.8% | -9.3% | 1.6% |
| Nifty Metal Index | 14.3% | 23.7% | 13.8% | 21.6% | 35.2% |
| Nifty Pharma Index | -2.6% | 1.9% | -2.5% | 18.8% | 14.5% |
| Nifty PSU Bank Index | 19.5% | 25.1% | 21.7% | 33.2% | 45.3% |
| Nifty Realty Index | 3.9% | 7.0% | -5.2% | 29.2% | 32.9% |
| BSE Consumer Durables Index | 1.8% | 5.4% | -0.2% | 12.4% | 20.2% |
| BSE Industrial Index | 4.3% | 16.4% | 1.6% | 31.2% | 41.8% |
| |
Global Index Performance |
| Name | 3 Months | 6 Months | 1 Year | 3 Years | 5 Years |
| MSCI World Index | 7.7% | 20.1% | 20.4% | 19.9% | 13.9% |
| MSCI Emerging Index | 12.7% | 25.9% | 25.2% | 18.2% | 4.9% |
| MSCI India index | 3.7% | 6.3% | 4.8% | 13.3% | 17.4% |
| Dow Jones Industrial Average Index | 7.8% | 17.0% | 13.9% | 13.3% | 12.4% |
| Nasdaq Composite Index | 12.3% | 36.0% | 31.1% | 29.2% | 16.8% |
| Nikkei 225 Index | 27.6% | 45.4% | 34.1% | 23.8% | 17.9% |
| Shanghai Composite Index | 10.7% | 20.6% | 20.6% | 11.0% | 4.2% |
| Deutsche Boerse AG german Stock Index DAX | -0.4% | 6.5% | 25.6% | 21.8% | 15.7% |