 
|
|
|
Key Events for the Month of September 2026
• India's Services Purchasing Managers' Index (PMI) rose to 54.1 in August up from 53.3 in July, the acceleration, the
overall pace of expansion remained the second weakest since March 2022 and stayed marginally below the long-run
average of 54.5.
• India's Manufacturing Purchasing Managers' Index (PMI) falls to fell to 52.8 in August from 53.5 in July, signalling a
notable slowdown driven by softer demand and moderating new orders.
• India's Consumer Price Inflation (CPI) increased to 4.82% in August from 4.45% in July. Despite a supportive
economic environment, this second consecutive increase above the RBI's 4.00% target validates the central bank's
cautious pause.
• India's Wholesale Price Index (WPI) inflation rose to 9.92% in August from 9.78% in July. On rising prices of food,
manufactured items, fuel and power.
• India's gross GST collections increased 14.7% year on year to ₹ 2,03,521 crore in September 2026. However, the
refunds slowed to ₹ 27,001 crore in September, a decline of 3% Y-o-Y.
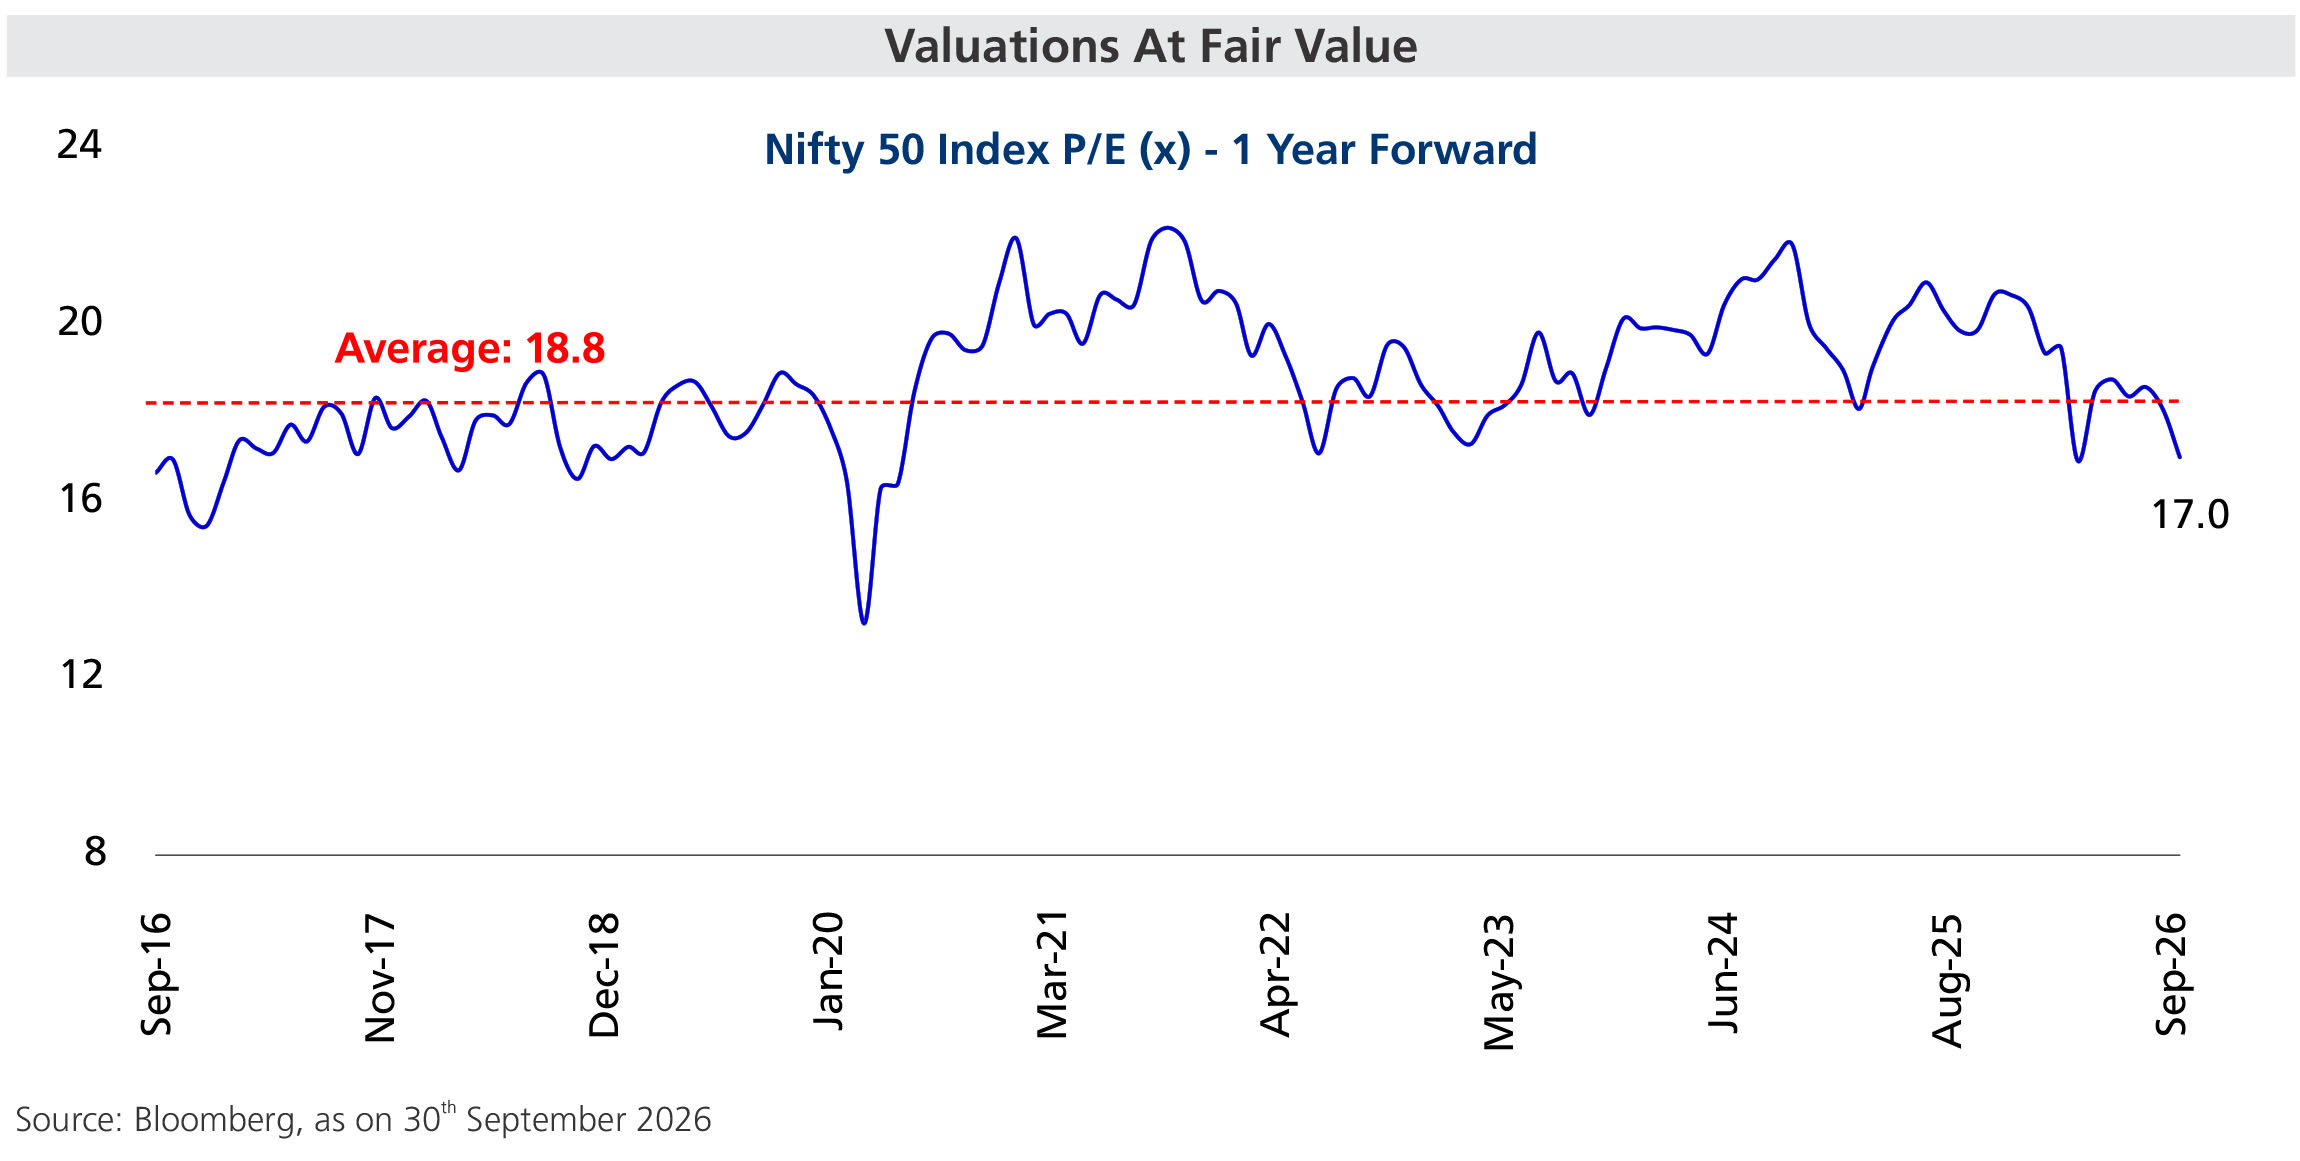
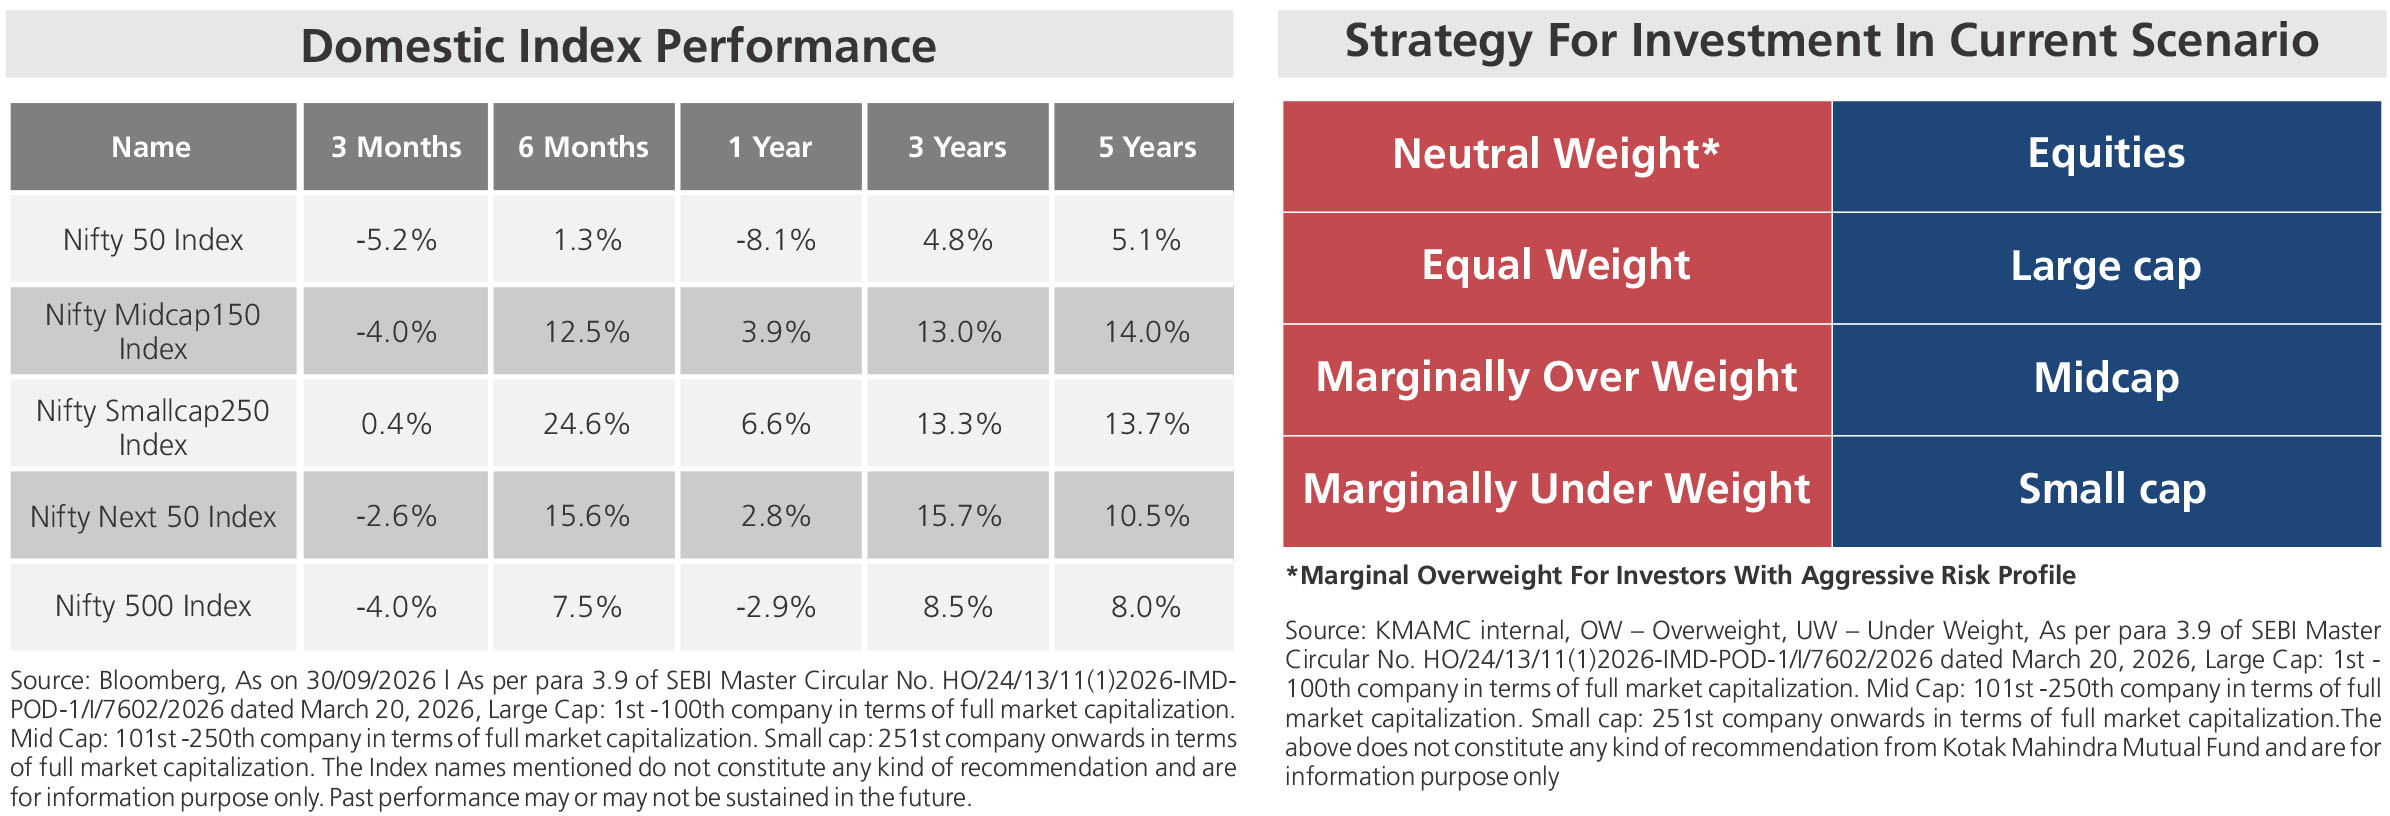
• Indian equity markets ended September lower, with the Nifty 50 declining 6.1% and the BSE Sensex falling 5.8%
during the month.
| |
Sectoral Index Performance |
| Name | 3 Months | 6 Months | 1 Year | 3 Years | 5 Years |
| Nifty Auto Index | -0.7% | 10.6% | -0.9% | 17.5% | 19.9% |
| Nifty Bank Index | -5.1% | 8.7% | 0.0% | 7.0% | 7.9% |
| Nifty Energy Index | -7.8% | 5.1% | 4.7% | 10.3% | 9.9% |
| Nifty Financial Services Index | -7.2% | 4.8% | -5.3% | 7.5% | 6.1% |
| Nifty FMCG Index | -8.8% | -2.3% | -18.6% | -4.8% | 1.9% |
| Nifty Healthcare Index | 0.0% | 13.6% | 14.1% | 18.4% | 23.7% |
| Nifty Infrastructure Index | -7.0% | 2.0% | -3.0% | 11.8% | 11.7% |
| Nifty IT Index | 5.3% | -4.7% | -17.7% | -4.5% | -4.6% |
| Nifty Media Index | 7.1% | 25.5% | 2.6% | -11.3% | -5.8% |
| Nifty Metal Index | 1.9% | 14.6% | 27.1% | 23.1% | 17.8% |
| Nifty Pharma Index | 4.4% | 18.9% | 23.2% | 19.6% | 12.8% |
| Nifty PSU Bank Index | -5.6% | 1.8% | 6.5% | 15.1% | 26.4% |
| Nifty Realty Index | 2.1% | 30.1% | -2.3% | 13.7% | 10.5% |
| BSE Consumer Durables Index | -1.7% | 11.4% | 1.6% | 8.9% | 7.2% |
| BSE Industrial Index | -4.4% | 20.5% | 9.1% | 16.2% | 25.0% |
Past performance may or may not be sustained in the future.
| |
Global Index Performance |
| Name | 3 Months | 6 Months | 1 Year | 3 Years | 5 Years |
| MSCI World Index | 1.6% | 15.1% | 13.8% | 19.7% | 10.3% |
| MSCI Emerging Index | -1.0% | 22.0% | 26.7% | 21.4% | 6.3% |
| MSCI India index | -4.7% | 4.3% | -4.7% | 7.5% | 6.2% |
| Dow Jones Industrial Average Index | -2.7% | 9.8% | 9.7% | 14.9% | 8.5% |
| Nasdaq Composite Index | 2.5% | 24.4% | 18.5% | 26.6% | 13.2% |
| Nikkei 225 Index | -4.7% | 30.7% | 48.6% | 27.9% | 17.8% |
| Shanghai Composite Index | -6.2% | -1.3% | -1.0% | 7.3% | 1.5% |
| Deutsche Boerse AG german Stock Index DAX | 0.8% | 11.1% | 5.5% | 17.8% | 10.5% |
Past performance may or may not be sustained in the future.