An open ended debt scheme predominantly investing in AA+ and above rated corporate bonds.
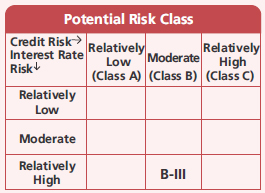
A relatively high interest rate risk and moderate credit risk.
An open ended debt scheme predominantly investing in AA+ and above rated corporate bonds.
A relatively high interest rate risk and moderate credit risk.
 |
 |
 
|
|
|
|
| Issuer/Instrument | Industry/ Rating |
% to Net Assets |
|---|---|---|
| Debt Instruments | ||
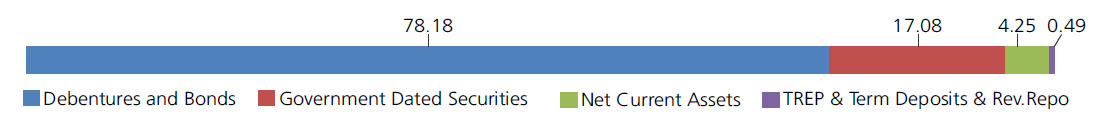
| Debentures and Bonds | ||
| Government Dated Securities | ||
| 8.51% Central Government(^) | SOV | 7.37 |
| 7.38% Central Government | SOV | 6.90 |
| 7.69% Central Government(^) | SOV | 1.95 |
| 7.26% Central Government | SOV | 0.39 |
| 6.97% Karnataka State Govt-Karnataka | SOV | 0.24 |
| GS CG 12 Apr 2024 - (STRIPS) | SOV | 0.04 |
| GS CG 12 Oct 2023 - (STRIPS) | SOV | 0.04 |
| GS CG 12 Oct 2025 - (STRIPS) | SOV | 0.03 |
| GS CG 12 Oct 2024 - (STRIPS) | SOV | 0.03 |
| GS CG 12 Apr 2026 - (STRIPS) | SOV | 0.03 |
| GS CG 12 Apr 2025 - (STRIPS) | SOV | 0.03 |
| 7.84% Tamil Nadu State Govt-Tamil Nadu | SOV | 0.03 |
| Government Dated Securities - Total | 17.08 | |
| Public Sector Undertakings | ||
| Power Finance Corporation Ltd. | CRISIL AAA | 9.50 |
| National Bank for Agriculture & Rural Development | CRISIL AAA | 9.30 |
| Rural Electrification Corporation Ltd. (^) | CRISIL AAA | 5.47 |
| Small Industries Development Bank Of India | ICRA AAA | 3.64 |
| State Bank Of India.(Basel III TIER II Bonds) | CRISIL AAA | 3.60 |
| Small Industries Development Bank Of India | CRISIL AAA | 2.74 |
| DME Development Limited | CRISIL AAA | 1.00 |
| Nuclear Power Corporation Of India Ltd. | ICRA AAA | 0.74 |
| Mangalore Refinery and Petrochemicals Ltd. | FITCH AAA(IND) | 0.71 |
| Public Sector Undertakings - Total | 36.70 | |
| Corporate Debt/Financial Institutions | ||
| HDFC Ltd.(^) | CRISIL AAA | 8.51 |
| Bajaj Housing Finance Ltd. | CRISIL AAA | 3.96 |
| LIC Housing Finance Ltd. | CRISIL AAA | 3.90 |
| L&T Metro Rail (Hyderabad) Ltd ( Axis Trusteeship services Ltd . Guaranteed by Larsen & Toubro Limited. ) | CRISIL AAA(CE) | 3.82 |
| Jamnagar Utilities & Power Private Limited ( Mukesh Ambani Group ) | CRISIL AAA | 3.10 |
| Bajaj Finance Ltd. | CRISIL AAA | 2.69 |
| Sikka Ports & Terminals Ltd. ( Mukesh Ambani Group ) | CRISIL AAA | 2.41 |
| Bajaj Finance Ltd. | CRISIL AAA | 2.25 |
| Mindspace Business Parks REIT | CRISIL AAA | 1.46 |
| Embassy Office Parks REIT | CRISIL AAA | 1.43 |
| Mahindra & Mahindra Financial Services Ltd. | FITCH AAA(IND) | 1.22 |
| LIC Housing Finance Ltd. | CRISIL AAA | 1.20 |
| Tata Capital Financial Services Limited | ICRA AAA | 0.98 |
| HDB Financial Services Ltd.(^) | CRISIL AAA | 0.98 |
| HDB Financial Services Ltd. | CRISIL AAA | 0.98 |
| John Deere Financial India Private Limited | CRISIL AAA | 0.71 |
| HDFC Ltd. | CRISIL AAA | 0.49 |
| ICICI Bank Ltd.(Basel III TIER II Bonds) | ICRA AAA | 0.48 |
| India Grid Trust | CRISIL AAA | 0.43 |
| Mahindra & Mahindra Financial Services Ltd. | FITCH IND AAA | 0.24 |
| L&T Metro Rail (Hyderabad) Ltd ( Axis Trusteeship services Ltd . Guaranteed by Larsen & Toubro Limited.) | CRISIL AAA(CE) | 0.24 |
| Corporate Debt/Financial Institutions - Total | 41.48 | |
| Triparty Repo | 0.49 | |
| Net Current Assets/(Liabilities) | 4.25 | |
| Grand Total | 100.00 | |

| Monthly SIP of (₹) 10000 | Since Inception | 10 years | 7 years | 5 years | 3 years | 1 year |
| Total amount invested (₹) | 18,80,000 | 12,00,000 | 8,40,000 | 6,00,000 | 3,60,000 | 1,20,000 |
| Total Value as on Apr 28, 2023 (₹) | 35,10,334 | 17,27,691 | 10,55,890 | 6,97,134 | 3,87,980 | 1,24,295 |
| Scheme Returns (%) | 7.53 | 7.10 | 6.45 | 5.96 | 4.96 | 6.83 |
| CRISIL Corporate Bond B-II Index Returns (%) | 8.14 | 7.67 | 7.14 | 6.78 | 5.67 | 7.34 |
| Alpha | -0.61 | -0.57 | -0.69 | -0.81 | -0.71 | -0.51 |
| CRISIL Corporate Bond B-II Index (₹)# | 37,00,361 | 17,80,057 | 10,81,965 | 7,11,427 | 3,92,123 | 1,24,614 |
| CRISIL Corporate Bond Composite Index Returns (%) | 8.27 | 7.59 | 6.91 | 6.66 | 5.21 | 7.73 |
| Alpha | -0.74 | -0.50 | -0.46 | -0.70 | -0.25 | -0.90 |
| CRISIL Corporate Bond Composite Index (₹)# | 37,44,066 | 17,73,046 | 10,73,396 | 7,09,359 | 3,89,426 | 1,24,856 |
| CRISIL 10 Year Gilt Index (₹)^ | 31,29,016 | 16,28,151 | 10,08,721 | 6,79,628 | 3,80,517 | 1,26,059 |
| CRISIL 10 Year Gilt Index (%) | 6.19 | 5.96 | 5.17 | 4.95 | 3.66 | 9.67 |
Alpha is difference of scheme return with benchmark return.
| Regular Plan-Growth Option | Rs3,193.3907 |
| Direct Plan- Growth Option | Rs3,310.3120 |
| Monthly-Reg-Plan-IDCW | Rs1,044.3532 |
| Monthly-Dir-Plan-IDCW | Rs1,077.6845 |
A) Regular Plan B) Direct Plan
Options:Payout of IDCW, Reinvestment of
IDCW & Growth (applicable for all plans)
| Fund Manager* | Mr. Deepak Agrawal,
Mr. Manu Sharma &
Mr. Vihag Mishra (Dedicated fund manager for investments in foreign securities) |
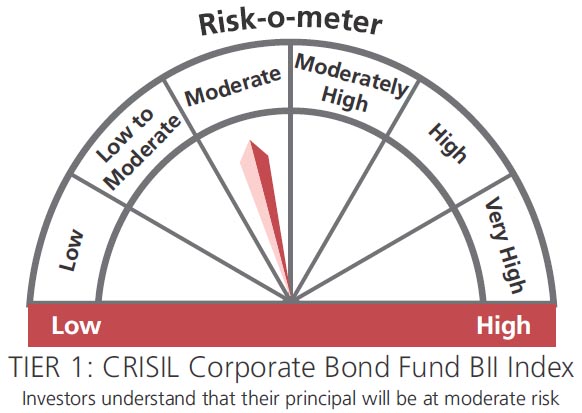
| Benchmark*** | CRISIL Corporate
Bond Fund B-II Index (Tier 1) CRISIL Corporate Bond Composite Index (Tier 2) |
| Allotment date | September 21, 2007 |
| AAUM | Rs9,989.57 crs |
| AUM | Rs10,245.21 crs |
| Folio count | 34,611 |
Monthly (12th of every Month)
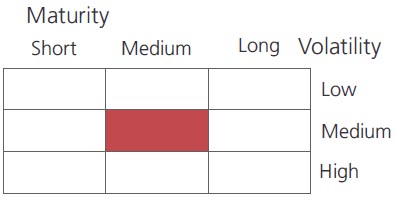
| Portfolio Average Maturity | 3.74 yrs |
| IRS Average Maturity* | 0.20 yrs |
| Net Average Maturity | 3.94 yrs |
| Portfolio Modified Duration | 2.12 yrs |
| IRS Modified Duration* | 0.17 yrs |
| Net Modified Duration | 2.29 yrs |
| Portfolio Macaulay Duration | 2.26 yrs |
| IRS Macaulay Duration* | 0.17 yrs |
| Net Macaulay Duration | 2.44 yrs |
| Annualised YTM* | 7.69% |
| $Standard Deviation | 1.34% |
*Interest Rate Swap
*in case of semi annual YTM, it will be annualized.
Source: $ICRAMFI Explorer. Standard Deviation is calculated on Annualised basis using 3 years history of monthly returns.
Initial Investment:Rs5000 and in multiple
of Rs1 for purchase and for Rs0.01 for
switches
Additional Investment: Rs1000 & in multiples
of Rs1 for purchase and for Rs0.01
for switches.
Ideal Investment Horizon: 1-1.5 year
Entry Load: Nil. (applicable for all plans)
Exit Load: Nil. (applicable for all plans)
Regular: 0.67%; Direct: 0.33%
Fund
Benchmark
Benchmark
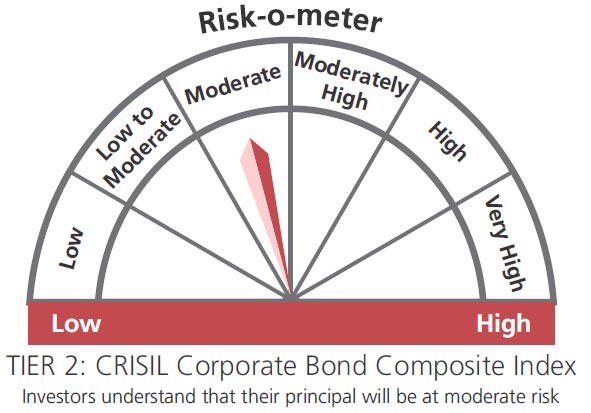
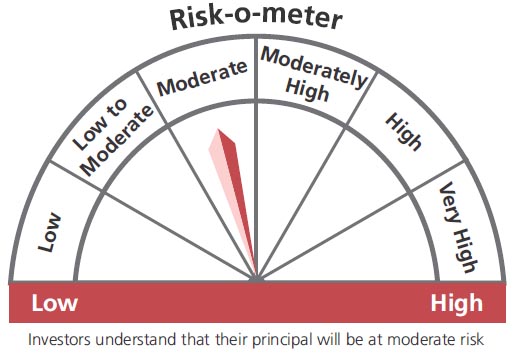
This product is suitable for investors who are seeking*:
- Regular Income over short term
- Income by investing in fixed income securities of varying maturities and predominantly investing in AA+ and above rated corporate bonds.
* Investors should consult their financial advisers if in doubt about whether the product is suitable for them.
The above risk-o—meter is based on the scheme portfolio as on 30th April, 2023. An addendum may be issued or updated on the website for new riskometer.
(^) Fully or Party blocked against Interest Rate Swap (IRS) Hedging Position through Interest Rate Swaps as on 30 Apr 2023 is 6.35% of the net assets.
**Total Expense Ratio includes applicable B30 fee and GST
***As per SEBI circular no. SEBI/HO/IMD/IMD-11 DF3/P/CIR/2021 /652 dated October 27, 2021; AMFI letter no. 35P/MEM-COR/70/2021-22 dated November 25, 2021 and AMFI letter no. 35P/ MEM-COR/ 131 / 2021-22 dated March 31, 2022 with effect from April 01, 2022 ("Effective date"), the first tier benchmark index of the scheme. Existing benchmark will be Second Tier benchmark for aforementioned scheme.
* For Fund Manager experience, please refer 'Our Fund Managers'
For last three IDCW, please refer 'Dividend History'.
For scheme performance, please refer 'Scheme Performances'