An open ended equity scheme investing in the Banking and Financial Services sectors
An open ended equity scheme investing in the Banking and Financial Services sectors
 |
 |
  
|
|
|
|
The investment objective of the scheme is to generate long-term capital appreciation from a portfolio that is invested predominantly in equity and equity related securities of companies engaged in banking and financial services sector. However, there is no assurance that the objective of the scheme will be achieved.
The investment objective of the scheme is to generate long-term capital appreciation from a portfolio that is invested predominantly in equity and equity related securities of companies engaged in banking and financial services sector. However, there is no assurance that the objective of the scheme will be achieved.
| Issuer/Instrument | |
% to Net Assets |
|---|---|---|
| Equity & Equity related | ||
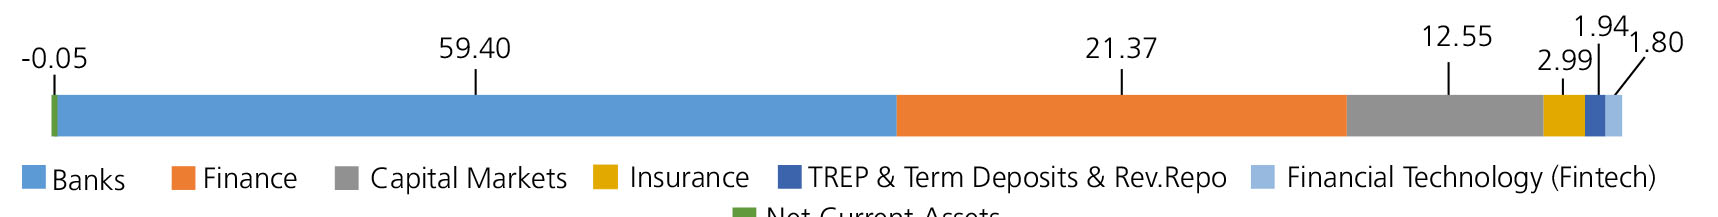
| Banks | 59.40 | |
| HDFC Bank Ltd. | 11.75 | |
| ICICI Bank Ltd. | 11.21 | |
| STATE BANK OF INDIA | 8.37 | |
| Axis Bank Ltd. | 8.08 | |
| KOTAK MAHINDRA BANK LTD. | 3.41 | |
| BANK OF MAHARASHTRA | 2.41 | |
| IndusInd Bank Ltd. | 2.36 | |
| JAMMU AND KASHMIR BANK LTD. | 2.02 | |
| Bank Of Baroda | 1.99 | |
| Ujjivan Small Finance Bank Ltd. | 1.93 | |
| KARUR VYSYA BANK LTD. | 1.84 | |
| RBL Bank Ltd | 1.51 | |
| INDIAN BANK | 1.46 | |
| SOUTH INDIAN BANK LTD. | 1.05 | |
| FEDERAL BANK LTD. | 0.01 | |
| Finance | 21.37 | |
| BAJAJ FINANCE LTD. | 5.73 | |
| SHRIRAM FINANCE LTD. | 4.66 | |
| Power Finance Corporation Ltd. | 2.24 | |
| POONAWALLA FINCORP LTD. | 2.18 | |
| Cholamandalam Investment and Finance Company Ltd. | 2.07 | |
| APTUS VALUE HOUSING FINANCE | 1.62 | |
| PIRAMAL FINANCE LTD | 1.30 | |
| INDIA SHELTER FINANCE CORPORATION LTD | 0.84 | |
| HOME FIRST FINANCE CO INDIA | 0.73 | |
| Capital Markets | 12.55 | |
| BSE LTD. | 4.99 | |
| NIPPON LIFE INDIA ASSET MANAGEMENT LTD. | 2.55 | |
| NUVAMA WEALTH MANAGEMENT LIMITED | 1.62 | |
| BILLIONBRAINS GARAGE VENTURES LIMITED (GROWW) | 1.39 | |
| Prudent Corporate Advisory Services Ltd. | 1.09 | |
| COMPUTER AGE MANAGEMENT SERVICES LIMITED | 0.91 | |
| Insurance | 2.99 | |
| SBI Life Insurance Company Ltd | 2.01 | |
| Max Financial Services Ltd. | 0.98 | |
| Financial Technology (Fintech) | 1.80 | |
| ONE 97 COMMUNICATIONS LTD. | 1.80 | |
| Equity & Equity related - Total | 98.11 | |
| Triparty Repo | 1.94 | |
| Net Current Assets/(Liabilities) | -0.05 | |
| Grand Total | 100.00 | |
| | ||
| Monthly SIP of (Rs) 10000 | Since Inception | 3 Years | 1 year |
| Total amount invested (₹) | 4,00,000 | 3,60,000 | 1,20,000 |
| Total Value as on May 29, 2026 (₹) | 4,62,713 | 4,03,997 | 1,18,471 |
| Scheme Returns (%) | 8.76 | 7.68 | -2.39 |
| Nifty Financial Services Index TRI Returns (%) | 7.66 | 6.57 | -7.77 |
| Alpha* | 1.10 | 1.10 | 5.38 |
| Nifty Financial Services Index TRI (₹)# | 4,54,498 | 3,97,463 | 1,14,986 |
| Nifty 50 (TRI) (₹)^ | 4,31,317 | 3,75,779 | 1,14,002 |
| Nifty 50 (TRI) Returns (%) | 4.49 | 2.82 | -9.28 |
| Regular | Direct | |
| Growth | Rs15.3352 | Rs16.1298 |
| IDCW | Rs15.3351 | Rs16.1274 |
A) Regular Plan B) Direct Plan
Options: Growth and Income Distribution cum capital withdrawal (IDCW) (Payout and Reinvestment)
| Fund Manager* | Ms. Shibani Sircar
Kurian & Mr. Abhishek Bisen |
| Benchmark | Nifty Financial Services Index TRI |
| Allotment date | February 27, 2023 |
| AAUM | Rs1,456.39 crs |
| AUM | Rs1,445.59 crs |
| Folio count | 60,251 |
Trustee's Discretion
| Portfolio Turnover | 27.51% |
| $Beta | 1.00 |
| $Sharpe ## | 0.43 |
| $Standard Deviation | 16.00% |
| ^^(P/E) | 16.40 |
| ^^P/BV | 2.23 |
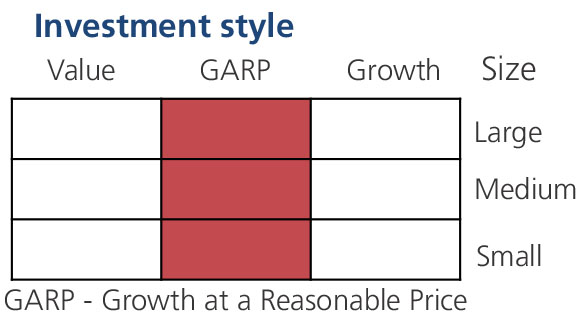
| Large Cap | 61.52% |
| Mid Cap | 21.43% |
| Small Cap | 15.16% |
| Debt & Money Market | 1.89% |
*% of Net Asset
Initial & Additional Investment
• Rs100 and any amount thereafter
Systematic Investment Plan (SIP)
• Rs 100 and any amount thereafter
• 5 years & above
Entry Load: Nil. (applicable for all plans)
Exit Load:
• For redemption / switch out within 30
days from the date of allotment: 0.5%
• If units are redeemed or switched out on
or after 30 days from the date of allotment:
NIL
| Regular Plan: | 2.14% |
| Direct Plan: | 0.69% |
Folio Count data as on 30th April 2026.
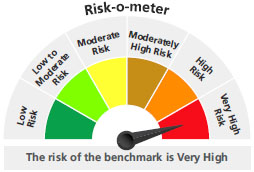
Benchmark : Nifty Financial Services Index TRI
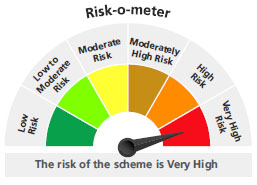
This product is suitable for investors who are seeking*:
- Long term capital growth
- Investment in portfolio of predominantly equity & equity related securities of companies engaged in Banking & Financial Services
* Investors should consult their financial advisors if in doubt about whether the product is suitable for them.
For latest Riskometer, investors may refer to an addendum issued or updated on website at www.kotakmf.com
* For Fund Manager experience, please refer 'For Regular Plan' & 'For Direct Plan'
For scheme performance, please refer 'For Regular Plan' & 'For Direct Plan'