| KOTAK NIFTY 100 EQUAL WEIGHT INDEX FUND
An open-ended scheme replicating/tracking the Nifty 100 equal weight Index
An open-ended scheme replicating/tracking the Nifty 100 equal weight Index
| KOTAK NIFTY 100 EQUAL WEIGHT INDEX FUND
An open-ended scheme replicating/tracking the Nifty 100 equal weight Index
An open-ended scheme replicating/tracking the Nifty 100 equal weight Index
 |
 |
  
|
|
|
|
Investment Objective
The investment objective of the scheme is to provide returns that, before expenses, corresponding to the total returns of the securities as represented by the
underlying index, subject to tracking errors. However, there is no guarantee or assurance that the investment objective of the scheme will be achieved..
The investment objective of the scheme is to provide returns that, before expenses, corresponding to the total returns of the securities as represented by the
underlying index, subject to tracking errors. However, there is no guarantee or assurance that the investment objective of the scheme will be achieved.
| Issuer/Instrument | |
% to Net Assets |
|---|---|---|
| Equity & Equity related | ||
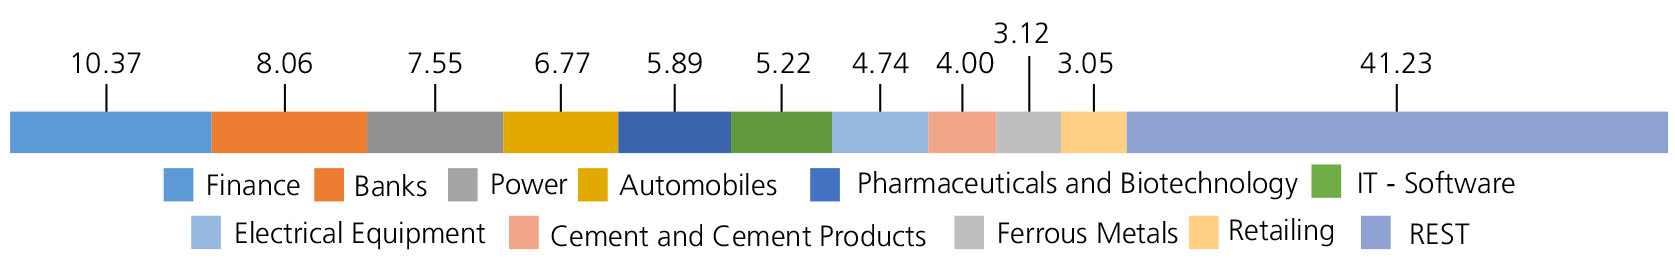
| Finance | 10.37 | |
| Bajaj Holdings and Investment Ltd. | 0.99 | |
| Cholamandalam Investment and Finance Company Ltd. | 0.97 | |
| Power Finance Corporation Ltd. | 0.97 | |
| BAJAJ FINANCE LTD. | 0.96 | |
| Muthoot Finance Ltd | 0.95 | |
| REC LTD | 0.95 | |
| Bajaj Finserv Ltd. | 0.94 | |
| INDIAN RAILWAY FINANCE CORPORATION LTD. | 0.94 | |
| SHRIRAM FINANCE LTD. | 0.94 | |
| JIO FINANCIAL SERVICES LTD | 0.92 | |
| TATA CAPITAL LIMITED | 0.84 | |
| Banks | 8.06 | |
| Axis Bank Ltd. | 0.97 | |
| KOTAK MAHINDRA BANK LTD. | 0.94 | |
| ICICI Bank Ltd. | 0.90 | |
| Bank Of Baroda | 0.89 | |
| PUNJAB NATIONAL BANK | 0.89 | |
| CANARA BANK | 0.88 | |
| HDFC Bank Ltd. | 0.88 | |
| UNION BANK OF INDIA | 0.87 | |
| STATE BANK OF INDIA | 0.84 | |
| Power | 7.55 | |
| ADANI GREEN ENERGY LTD. | 1.58 | |
| ADANI POWER LTD. | 1.46 | |
| ADANI ENERGY SOLUTIONS LTD. | 1.41 | |
| Tata Power Co. Ltd. | 0.98 | |
| NTPC LTD | 0.93 | |
| Power Grid Corporation Of India Ltd. | 0.87 | |
| MALCO ENERGY LTD- VEDANTA OIL AND GAS LTD.** | 0.16 | |
| TALVANDI SABO POWER LTD- VEDANTA POWER LTD.** | 0.16 | |
| Automobiles | 6.77 | |
| TATA MOTORS PASSENGER VEHICLES LTD. | 1.14 | |
| Bajaj Auto Ltd. | 1.05 | |
| Maruti Suzuki India Limited | 0.95 | |
| Eicher Motors Ltd. | 0.94 | |
| HYUNDAI MOTORS INDIA LTD | 0.93 | |
| Mahindra & Mahindra Ltd. | 0.90 | |
| TVS Motors Company Ltd | 0.86 | |
| Pharmaceuticals and Biotechnology | 5.89 | |
| Zydus Lifesciences Limited | 1.09 | |
| Cipla Ltd. | 1.03 | |
| Divi s Laboratories Ltd. | 0.99 | |
| Torrent Pharmaceuticals Ltd. | 0.93 | |
| DR REDDYS LABORATORIES LTD. | 0.93 | |
| Sun Pharmaceuticals Industries Ltd. | 0.92 | |
| IT - Software | 5.22 | |
| WIPRO LTD. | 0.97 | |
| Tech Mahindra Ltd. | 0.93 | |
| LTIMINDTREE LIMITED | 0.87 | |
| Tata Consultancy Services Ltd. | 0.85 | |
| Infosys Ltd. | 0.82 | |
| HCL TECHNOLOGIES LTD. | 0.78 | |
| Electrical Equipment | 4.74 | |
| SIEMENS ENERGY INDIA LTD | 1.30 | |
| CG POWER AND INDUSTRIAL SOLUTIONS LIMITED | 1.24 | |
| Siemens Ltd. | 1.15 | |
| ABB India Ltd | 1.05 | |
| Cement and Cement Products | 4.00 | |
| Grasim Industries Ltd. | 1.10 | |
| Ambuja Cements Ltd. | 0.99 | |
| Ultratech Cement Ltd. | 0.96 | |
| SHREE CEMENT LTD. | 0.95 | |
| Ferrous Metals | 3.12 | |
| JSW Steel Ltd. | 1.01 | |
| Tata Steel Ltd. | 0.98 | |
| Jindal Steel & Power Ltd. | 0.97 | |
| VEDANTA IRON & STEEL LTD** | 0.16 | |
| Retailing | 3.05 | |
| Trent Ltd | 1.13 | |
| AVENUE SUPERMARTS LTD. | 0.97 | |
| ETERNAL LIMITED | 0.95 | |
| Petroleum Products | 2.70 | |
| Bharat Petroleum Corporation Ltd. | 0.95 | |
| Indian Oil Corporation Ltd | 0.91 | |
| RELIANCE INDUSTRIES LTD. | 0.84 | |
| Non - Ferrous Metals | 2.50 | |
| Hindalco Industries Ltd | 1.19 | |
| HINDUSTAN ZINC LTD. | 1.15 | |
| VEDANTA ALUMINIUM METAL LTD** | 0.16 | |
| Chemicals and Petrochemicals | 2.30 | |
| SOLAR INDUSTRIES INDIA LIMITED | 1.30 | |
| Pidilite Industries Ltd. | 1.00 | |
| Auto Components | 2.25 | |
| SAMVARDHANA MOTHERSON INTERNATIONAL LIMITED | 1.18 | |
| Bosch Ltd. | 1.07 | |
| Realty | 2.18 | |
| LODHA DEVELOPERS LTD. (MACROTECH DEVELOPERS LTD) | 1.16 | |
| DLF Ltd. | 1.02 | |
| Beverages | 2.08 | |
| VARUN BEVERAGES LTD | 1.22 | |
| UNITED SPIRITS LTD. | 0.86 | |
| Consumer Durables | 2.03 | |
| Asian Paints Ltd. | 1.09 | |
| Titan Company Ltd. | 0.94 | |
| Aerospace and Defense | 1.95 | |
| HINDUSTAN AERONAUTICS LTD. | 1.06 | |
| Bharat Electronics Ltd. | 0.89 | |
| Food Products | 1.93 | |
| NESTLE INDIA LTD. | 1.08 | |
| Britannia Industries Ltd. | 0.85 | |
| Healthcare Services | 1.88 | |
| Apollo Hospitals Enterprises Ltd. | 0.99 | |
| MAX HEALTHCARE INSTITUTE LTD. | 0.89 | |
| Diversified FMCG | 1.82 | |
| Hindustan Unilever Ltd. | 0.93 | |
| ITC Ltd. | 0.89 | |
| Insurance | 1.79 | |
| SBI Life Insurance Company Ltd | 0.90 | |
| HDFC Life Insurance Company Ltd. | 0.89 | |
| Metals and Minerals Trading | 1.45 | |
| Adani Enterprises Ltd. | 1.45 | |
| Transport Infrastructure | 1.21 | |
| Adani Port and Special Economic Zone Ltd. | 1.21 | |
| Industrial Products | 1.14 | |
| Cummins India Ltd. | 1.14 | |
| Gas | 1.07 | |
| GAIL (India) Ltd. | 1.07 | |
| Construction | 1.04 | |
| Larsen And Toubro Ltd. | 1.04 | |
| Capital Markets | 1.02 | |
| HDFC Asset Management Company Ltd. | 1.02 | |
| Agricultural Food and other Product | 1.01 | |
| Tata Consumer Products Ltd | 1.01 | |
| Industrial Manufacturing | 0.98 | |
| MAZAGOAN DOCK SHIPBUILDERS LTD | 0.98 | |
| Leisure Services | 0.97 | |
| INDIAN HOTELS COMPANY LTD. | 0.97 | |
| Transport Services | 0.95 | |
| Inter Globe Aviation Ltd | 0.95 | |
| Consumable Fuels | 0.93 | |
| Coal India Ltd. | 0.93 | |
| Personal Products | 0.92 | |
| Godrej Consumer Products Ltd. | 0.92 | |
| Telecom - Services | 0.91 | |
| Bharti Airtel Ltd | 0.91 | |
| Oil | 0.89 | |
| Oil & Natural Gas Corporation Ltd. | 0.89 | |
| Agricultural, Commercial and Construction vehicles | 0.82 | |
| TML COMMERCIAL VEHICLES LIMITED | 0.82 | |
| Diversified Metals | 0.49 | |
| Vedanta Ltd. | 0.49 | |
| Equity & Equity related - Total | 99.98 | |
| Net Current Assets/(Liabilities) | 0.02 | |
| Grand Total | 100.00 | |
Net Asset Value (NAV)
| Regular | Direct | |
| Growth | Rs10.8212 | Rs10.8992 |
| IDCW | Rs10.8213 | Rs10.8986 |
Available Plans/Options
A) Regular Plan B) Direct Plan
Options: a) Growth and Income
Distribution cum capital withdrawal
(IDCW) (Payout and Reinvestment)
| Fund Manager* | Mr. Satish Dondapati, Mr. Abhishek Bisen, Mr. Jeetu Valechha Sonar |
| Benchmark | Nifty 100 Equal Weight Index (TRI) |
| Allotment date | December 23, 2024 |
| AAUM | Rs42.68 crs |
| AUM | Rs43.19 crs |
| Folio count | 4,676 |
Ratios
| Portfolio Turnover | 47.32% |
| Tracking Error | 0.14% |
Minimum Investment Amount
Initial & Additional Investment
• Rs100 and any amount thereafter
Systematic Investment Plan (SIP)
• Rs 100 and any amount thereafter
Ideal Investments Horizon
• 5 years & above
IDCW Frequency
Trustee’s Discretion
Load Structure
Entry Load:
NIL. (applicable for all plans)
Exit Load:
Nil. (applicable for all plans)
Total Expense Ratio**
| Regular Plan: | 0.72% |
| Direct Plan: | 0.21% |
Data as on 31st May, 2026 unless
otherwise specified.
Folio Count data as on 30th April 2026.
Folio Count data as on 30th April 2026.
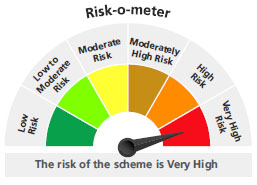
Fund
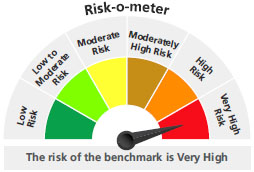
Benchmark : Nifty 100 Equal Weight Index (TRI)
This product is suitable for investors who are seeking*:
- Long term capital growth
- Return that corresponds to the performance of Nifty 100 Equal Weight Index subject to tracking error.
* Investors should consult their financial advisors if in doubt about whether the product is suitable for them.
For latest Riskometer, investors may refer to an addendum issued or updated on website at www.kotakmf.com
**Total Expense Ratio includes applicable GST.
* For Fund Manager experience, please refer 'For Regular Plan' & 'For Direct Plan'
For scheme performance, please refer 'For Regular Plan' & 'For Direct Plan'