An open ended hybrid scheme investing predominantly in equity and equity related instruments
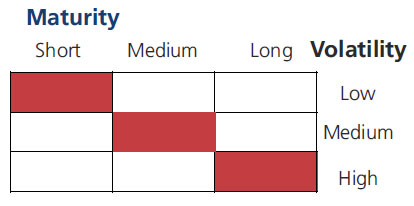
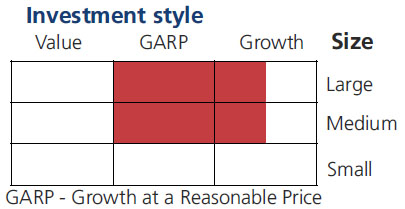
An open ended hybrid scheme investing predominantly in equity and equity related instruments
 |
 |
  
|
|
|
|
| Issuer/Instrument | Rating | % to Net Assets |
|---|---|---|
| Equity & Equity related | ||
| Banks | 11.18 | |
| ICICI Bank Ltd. | 2.98 | |
| STATE BANK OF INDIA | 2.87 | |
| HDFC Bank Ltd. | 2.50 | |
| INDIAN BANK | 1.69 | |
| BANK OF MAHARASHTRA | 1.14 | |
| Finance | 10.70 | |
| SHRIRAM FINANCE LTD. | 2.54 | |
| Cholamandalam Investment and Finance Company Ltd. | 2.50 | |
| BAJAJ FINANCE LTD. | 1.74 | |
| Power Finance Corporation Ltd. | 1.48 | |
| POONAWALLA FINCORP LTD. | 0.99 | |
| REC LTD | 0.71 | |
| TATA CAPITAL LIMITED | 0.57 | |
| L&T FINANCE LTD | 0.17 | |
| Retailing | 5.28 | |
| ETERNAL LIMITED | 3.25 | |
| VISHAL MEGA MART LIMITED | 1.09 | |
| SWIGGY LTD | 0.94 | |
| Healthcare Services | 5.07 | |
| Fortis Healthcare India Ltd | 2.73 | |
| Apollo Hospitals Enterprises Ltd. | 1.46 | |
| MAX HEALTHCARE INSTITUTE LTD. | 0.88 | |
| IT - Software | 5.03 | |
| Mphasis Ltd | 1.48 | |
| Infosys Ltd. | 1.47 | |
| ORACLE FINANCIAL SERVICES SOFTWARE LTD | 1.13 | |
| Tech Mahindra Ltd. | 0.54 | |
| Birlasoft Ltd. | 0.41 | |
| Capital Markets | 4.92 | |
| BILLIONBRAINS GARAGE VENTURES LIMITED (GROWW) | 1.54 | |
| NIPPON LIFE INDIA ASSET MANAGEMENT LTD. | 1.17 | |
| Prudent Corporate Advisory Services Ltd. | 0.78 | |
| NUVAMA WEALTH MANAGEMENT LIMITED | 0.71 | |
| BSE LTD. | 0.38 | |
| NATIONAL STOCK EXCHANGE OF INDIA LIMITED (NSE) | 0.34 | |
| Aerospace and Defense | 3.98 | |
| Bharat Electronics Ltd. | 2.04 | |
| ROSSELL TECHSYS LTD. | 1.94 | |
| Consumer Durables | 3.75 | |
| DIXON TECHNOLOGIES INDIA LTD. | 1.69 | |
| Century Plyboards (India) Ltd. | 1.03 | |
| LG ELECTRONICS INDIA LTD | 1.03 | |
| Pharmaceuticals and Biotechnology | 3.20 | |
| Ipca Laboratories Ltd. | 1.40 | |
| Sun Pharmaceuticals Industries Ltd. | 0.90 | |
| TORRENT PHARMACEUTICALS LTD. | 0.90 | |
| Chemicals and Petrochemicals | 3.16 | |
| SOLAR INDUSTRIES INDIA LIMITED | 1.49 | |
| SRF Ltd. | 1.07 | |
| Deepak Nitrite Ltd. | 0.60 | |
| Telecom - Services | 2.90 | |
| Bharti Airtel Ltd | 2.90 | |
| Electrical Equipment | 2.68 | |
| GE VERNOVA T&D INDIA LIMITED | 1.73 | |
| APAR INDUSTRIES LIMITED | 0.95 | |
| Auto Components | 2.26 | |
| Schaeffler India Ltd | 0.91 | |
| UNO MINDA LIMITED | 0.89 | |
| MRF Limited | 0.46 | |
| Healthcare Equipment and Supplies | 2.17 | |
| MOLBIO DIAGNOSTICS LIMITED | 2.17 | |
| Petroleum Products | 1.43 | |
| Bharat Petroleum Corporation Ltd. | 0.72 | |
| RELIANCE INDUSTRIES LTD. | 0.71 | |
| Ferrous Metals | 1.13 | |
| Jindal Steel & Power Ltd. | 1.13 | |
| Beverages | 1.05 | |
| UNITED SPIRITS LTD. | 1.05 | |
| Construction | 0.89 | |
| TECHNO ELECTRIC & ENGINEERING COMPANY LIMITED | 0.89 | |
| Cement and Cement Products | 0.75 | |
| JK Cement Ltd. | 0.75 | |
| Industrial Products | 0.70 | |
| Polycab India Ltd. | 0.70 | |
| Fertilizers and Agrochemicals | 0.68 | |
| P I INDUSTRIES LTD | 0.68 | |
| Food Products | 0.62 | |
| AVANTI FEEDS LTD | 0.62 | |
| Realty | 0.60 | |
| OBEROI REALTY LTD | 0.60 | |
| Agricultural, Commercial and Constr | 0.26 | |
| V.S.T Tillers Tractors Ltd | 0.26 | |
| Equity & Equity related - Total | 74.39 | |
| Debt Instruments | ||
| Debentures and Bonds | ||
| Corporate Debt/Financial Institutions | ||
| 360 ONE PRIME LTD. | ICRA AA | 0.56 |
| MUTHOOT FINANCE LTD. | CRISIL AA+ | 0.28 |
| ANDHRA PRADESH STATE BEVERAGES CORPORATION LIMITED | FITCH AA(CE) | 0.23 |
| TATA CAPITAL HOUSING FINANCE LTD. | CRISIL AAA | 0.17 |
| KOTAK MAHINDRA INVESTMENTS LTD. | CRISIL AAA | 0.11 |
| Kotak Mahindra Prime Ltd. | CRISIL AAA | 0.11 |
| MUTHOOT FINANCE LTD. | CRISIL AA+ | 0.11 |
| ADITYA BIRLA CAPITAL LTD | ICRA AAA | 0.08 |
| Corporate Debt/Financial Institutions - Total | 1.65 | |
| Public Sector Undertakings | ||
| REC LTD | CRISIL AAA | 0.36 |
| SMALL INDUSTRIES DEVELOPMENT BANK OF INDIA | CRISIL AAA | 0.28 |
| Power Finance Corporation Ltd. | CRISIL AAA | 0.27 |
| TELANGANA STATE INDUSTRIAL INFRASTRUCTURE CORPORATION LTD. | FITCH AA(CE) | 0.20 |
| REC LTD | CRISIL AAA | 0.11 |
| Power Finance Corporation Ltd. | CRISIL AAA | 0.07 |
| Public Sector Undertakings - Total | 1.29 | |
| Government Dated Securities | ||
| 7.34% Central Government | SOV | 1.97 |
| 7.24% Central Government | SOV | 1.15 |
| 6.90% Central Government | SOV | 0.96 |
| 7.54% Tamil Nadu State Govt-Tamil Nadu | SOV | 0.60 |
| 6.79% Central Government | SOV | 0.22 |
| GS CG 15/10/2038 - (STRIPS) | SOV | 0.14 |
| GS CG 22/10/2038 - (STRIPS) | SOV | 0.14 |
| 7.21% Karnataka State Govt-Karnataka | SOV | 0.11 |
| 7.30% Central Government | SOV | 0.11 |
| GS CG 15/04/2036 - (STRIPS) | SOV | 0.08 |
| 7.62% Haryana State Govt-Haryana | SOV | 0.06 |
| 7.67% Punjab State Govt-Punjab | SOV | 0.06 |
| 8.00% Kerala State Govt-Kerala | SOV | 0.06 |
| 8.15% Tamil Nadu State Govt-Tamil Nadu | SOV | 0.06 |
| GS CG 22/10/2036 - (STRIPS) | SOV | 0.05 |
| GS CG 22/10/2039 - (STRIPS) | SOV | 0.04 |
| 7.26% Central Government | SOV | 0.03 |
| GS CG 19/06/2036 - (STRIPS) | SOV | 0.03 |
| 7.39% Tamil Nadu State Govt-Tamil Nadu | SOV | 0.02 |
| 7.71% Andhra Pradesh State Govt-Andhra Pradesh | SOV | 0.02 |
| 7.71% Gujarat State Govt-Gujarat | SOV | 0.02 |
| 7.78% Rajasthan State Govt-Rajasthan | SOV | 0.02 |
| 6.91% Rajasthan State Govt-Rajasthan | SOV | 0.01 |
| 7.09% Central Government | SOV | 0.01 |
| Government Dated Securities - Total | 5.97 | |
| Money Market Instruments | ||
| Commercial Paper(CP)/Certificate of Deposits(CD) | ||
| Corporate Debt/Financial Institutions | ||
| HDFC BANK LTD. | CARE A1+ | 1.63 |
| AXIS BANK LTD. | CRISIL A1+ | 0.27 |
| SUNDARAM FINANCE LTD. | CRISIL A1+ | 0.16 |
| Corporate Debt/Financial Institutions - Total | 2.06 | |
| Public Sector Undertakings | ||
| SMALL INDUSTRIES DEVELOPMENT BANK OF INDIA | CARE A1+ | 1.10 |
| BANK OF BARODA | FITCH A1+ | 1.09 |
| BHARAT PETROLEUM CORPORATION LTD. | CRISIL A1+ | 0.55 |
| BANK OF BARODA | CARE A1+ | 0.27 |
| Public Sector Undertakings - Total | 3.01 | |
| Reverse Repo | 3.35 | |
| Triparty Repo | 7.83 | |
| Net Current Assets/(Liabilities) | 0.45 | |
| Grand Total | 100.00 | |
| | ||

| Monthly SIP of (₹) 10000 | Since Inception | 10 years | 7 years | 5 years | 3 years | 1 year |
| Total amount invested (₹) | 14,30,000 | 12,00,000 | 8,40,000 | 6,00,000 | 3,60,000 | 1,20,000 |
| Total Value as on Sep 30, 2026 (₹) | 30,45,122 | 22,74,662 | 12,97,735 | 7,56,182 | 3,88,302 | 1,19,179 |
| Scheme Returns (%) | 12.02 | 12.29 | 12.22 | 9.19 | 4.99 | -1.27 |
| Nifty 50 Hybrid Composite Debt 65:35 Index Returns (%) | 9.36 | 9.03 | 7.73 | 4.93 | 0.60 | -8.58 |
| Alpha* | 2.65 | 3.26 | 4.49 | 4.27 | 4.38 | 7.31 |
| Nifty 50 Hybrid Composite Debt 65:35 Index (₹)# | 25,63,855 | 19,13,405 | 11,05,700 | 6,79,572 | 3,63,340 | 1,14,395 |
| Nifty 50 (TRI) (₹)^ | 27,62,936 | 20,37,783 | 11,50,994 | 6,73,946 | 3,52,171 | 1,11,040 |
| Nifty 50 (TRI) Returns (%) | 10.52 | 10.22 | 8.86 | 4.60 | -1.42 | -13.60 |
| Regular | Direct | |
| Growth | Rs62.8110 | Rs74.9010 |
| IDCW | Rs36.9130 | Rs45.9150 |
A) Regular Plan B) Direct Plan
Options: Payout of IDCW, Reinvestment of IDCW & Growth (applicable for all plans)
| Fund Manager* | Mr. Atul Bhole & Mr. Abhishek Bisen |
| Benchmark | Nifty 50 Hybrid Composite Debt 65:35 Index |
| Allotment date | November 25, 1999 |
| AAUM | Rs9,201.59 crs |
| AUM | Rs9,040.28 crs |
| Folio count | 1,77,501 |
Trustee’s Discretion
| Average Maturity | 7.52 yrs |
| Modified Duration | 3.37 yrs |
| Macaulay Duration | 3.48 yrs |
| Annualised YTM* | 6.61% |
| $Standard Deviation | 13.32% |
| $Beta | 1.26 |
| $Sharpe## | 0.42 |
| ^^P/E$$ | 22.24 |
| ^^P/BV$$ | 3.48 |
| Equity Portfolio Turnover$$ | 25.30% |
| Total Portfolio Turnover@ | 51.02% |
$$Equity Component of the Portfolio.
@Total Portfolio Turnover=Equity+Debt+Derivative.
| Large Cap | 39.00% |
| Mid Cap | 25.64% |
| Small Cap | 9.75% |
| Debt & Money Market | 25.61% |
*% of Net Asset
Initial & Additional Investment
• Rs100 and any amount thereafter
Systematic Investment Plan (SIP)
• Rs 100 and any amount thereafter
• 5 years & above
Entry Load: Nil. (applicable for all plans)
Exit Load:
• For redemption / switch out of upto 8% of
the initial investment amount (limit)
purchased or switched in within 1 year from
the date of allotment: Nil.
• If units redeemed or switched out are in
excess of the limit within 1 year from the
date of allotment: 1%
• If units are redeemed or switched out on
or after 1 year from the date of allotment:
NIL
| Regular Plan: | 1.78% |
| Direct Plan: | 0.53% |
Folio Count data as on 31st August 2026.
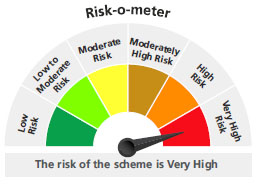
Fund
Benchmark: Nifty 50 Hybrid Composite Debt 65:35 Index
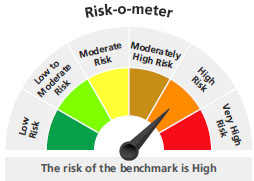
This product is suitable for investors who are seeking*:
- Long term capital growth
- Investment in equity & equity related securities balanced with income generation by investing in debt & money.
* Investors should consult their financial advisors if in doubt about whether the product is suitable for them.
For latest Riskometer, investors may refer to an addendum issued or updated on website at www.kotakmf.com
(^) Fully or Party blocked against Interest Rate Swap (IRS) (^)This scheme has exposure to floating rate instruments and / or interest rate derivatives. The duration of these instruments is linked to the interest rate reset period. The interest rate risk in a floating rate instrument or in a fixed rate instrument hedged with derivatives is likely to be lesser than that in an equivalent maturity fixed rate instrument. Under some market circumstances the volatility may be of an order greater than what may ordinarily be expected considering only its duration. Hence investors are recommended to consider the unadjusted portfolio maturity of the scheme as well and exercise adequate due diligence when deciding to make their investments. Alpha is difference of scheme return with benchmark return. Hedging Position through Interest Rate Swaps as on 30 Sep 2026 is 8.08% of the net assets.
## Risk rate assumed to be 5.28% (FBIL Overnight MIBOR rate as on 30th September 2026).**The expense ratio disclosed above represents the Base Expense Ratio (BER), including applicable statutory levies on expenses forming part of the BER, but excludes brokerage, transaction costs and related statutory levies. For Total Expense Ratio including brokerage, transaction cost and related statutory levies please refer our website: https://www.kotakmf.com/Information/TER.
* For Fund Manager experience, please refer 'For Regular Plan' & 'For Direct Plan'
For last three IDCW, please refer 'Dividend History'.
For scheme performance, please refer 'For Regular Plan' & 'For Direct Plan'