An open-ended equity scheme investing in Quant based investing theme.
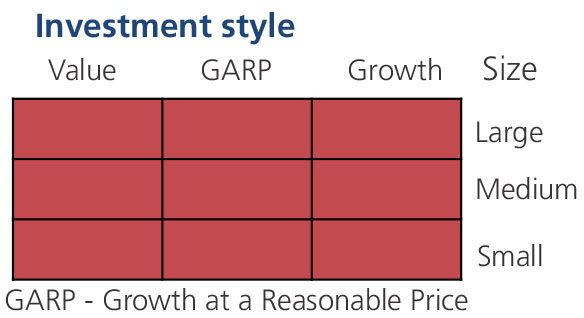
An open-ended equity scheme investing in Quant based investing theme.
 |
 |
  
|
|
|
|
The scheme shall seek to generate long term capital appreciation by investing predominantly in equity and equity related securities selected based on quant model theme. However, there is no assurance that the objective of the scheme will be achieved.
The scheme shall seek to generate long term capital appreciation by investing predominantly in equity and equity related securities selected based on quant model theme. However, there is no assurance that the objective of the scheme will be achieved.
| Issuer/Instrument | Rating |
% to Net Assets |
|---|---|---|
| Equity & Equity related | ||
| Pharmaceuticals and Biotechnology | 15.75 | |
| LAURUS LABS LTD. | 2.91 | |
| Divi s Laboratories Ltd. | 1.91 | |
| SAI LIFE SCIENCES LIMITED | 1.77 | |
| GLAND PHARMA LIMITED | 1.66 | |
| ACUTAAS CHEMICALS LTD | 1.43 | |
| Sun Pharmaceuticals Industries Ltd. | 1.19 | |
| Granules India Ltd. | 1.08 | |
| Lupin Ltd. | 1.01 | |
| DR REDDYS LABORATORIES LTD. | 0.98 | |
| NEULAND LABORATORIES LTD. | 0.76 | |
| Zydus Lifesciences Limited | 0.61 | |
| Biocon Ltd. | 0.44 | |
| Electrical Equipment | 8.65 | |
| Thermax Ltd. | 1.73 | |
| MTAR TECHNOLOGIES LTD. | 1.45 | |
| APAR INDUSTRIES LIMITED | 1.23 | |
| GE VERNOVA T&D INDIA LIMITED | 1.12 | |
| Siemens Ltd. | 0.85 | |
| Bharat Heavy Electricals Ltd. | 0.70 | |
| SCHNEIDER ELECTRIC INFRASTRUCTURE LTD | 0.59 | |
| TD POWER SYSTEMS LTD. | 0.48 | |
| ABB INDIA LTD | 0.43 | |
| EMMVEE PHOTOVOLTAIC POWER LIMITED | 0.07 | |
| Industrial Products | 7.02 | |
| R R KABEL LTD | 1.56 | |
| Welspun Corp Limited | 0.99 | |
| Cummins India Ltd. | 0.74 | |
| Kirloskar Oil Engines Ltd. | 0.72 | |
| Polycab India Ltd. | 0.71 | |
| KEI INDUSTRIES LTD. | 0.67 | |
| AIA Engineering Limited. | 0.66 | |
| APL APOLLO TUBES LTD. | 0.57 | |
| Timken India Ltd. | 0.40 | |
| Auto Components | 6.73 | |
| Bosch Ltd. | 1.98 | |
| SONA BLW PRECISION FORGINGS LTD | 1.97 | |
| Sundaram Fasteners Ltd. | 1.63 | |
| BHARAT FORGE LTD. | 0.75 | |
| Schaeffler India Ltd | 0.40 | |
| Automobiles | 6.17 | |
| Bajaj Auto Ltd. | 3.01 | |
| TVS Motors Company Ltd | 2.26 | |
| Eicher Motors Ltd. | 0.90 | |
| Chemicals and Petrochemicals | 5.54 | |
| Navin Fluorine International Ltd. | 2.28 | |
| Gujarat Fluorochemicals Ltd. | 1.81 | |
| HIMADRI SPECIALITY CHEMICAL LTD. | 1.45 | |
| Power | 5.16 | |
| ACME SOLAR HOLDINGS LTD. | 1.60 | |
| ADANI POWER LTD. | 1.55 | |
| ADANI GREEN ENERGY LTD. | 1.43 | |
| Power Grid Corporation Of India Ltd. | 0.58 | |
| Finance | 4.97 | |
| PNB HOUSING FINANCE LTD. | 1.99 | |
| PIRAMAL FINANCE LTD | 1.75 | |
| SHRIRAM FINANCE LTD. | 0.63 | |
| L&T FINANCE LTD | 0.60 | |
| Healthcare Services | 3.51 | |
| Apollo Hospitals Enterprises Ltd. | 2.79 | |
| ASTER DM HEALTHCARE LTD | 0.72 | |
| Food Products | 3.46 | |
| NESTLE INDIA LTD. | 3.46 | |
| IT - Software | 3.18 | |
| ORACLE FINANCIAL SERVICES SOFTWARE LTD | 1.83 | |
| COFORGE LIMITED | 1.35 | |
| Banks | 2.84 | |
| FEDERAL BANK LTD. | 0.92 | |
| AU Small Finance Bank Ltd. | 0.78 | |
| BANK OF MAHARASHTRA | 0.62 | |
| STATE BANK OF INDIA | 0.52 | |
| Beverages | 2.84 | |
| RADICO KHAITAN LTD. | 2.84 | |
| Industrial Manufacturing | 2.56 | |
| ADITYA INFOTECH LIMITED | 1.42 | |
| SYRMA SGS TECHNOLOGY LTD. | 1.14 | |
| Ferrous Metals | 2.47 | |
| JSW Steel Ltd. | 1.04 | |
| Tata Steel Ltd. | 0.85 | |
| Jindal Steel & Power Ltd. | 0.50 | |
| Steel Authority of India Ltd. | 0.08 | |
| IT - Services | 1.62 | |
| TATA TECHNOLOGIES LTD | 1.54 | |
| NETWEB TECHNOLOGIES INDIA LTD. | 0.08 | |
| Capital Markets | 1.58 | |
| BSE LTD. | 1.46 | |
| Aditya Birla Sun Life AMC Ltd | 0.12 | |
| Telecom - Services | 1.40 | |
| Vodafone Idea Ltd | 1.40 | |
| Metals and Minerals Trading | 1.37 | |
| ADANI ENTERPRISES LTD. | 1.37 | |
| Oil | 1.34 | |
| AEGIS VOPAK TERMINALS LTD | 1.34 | |
| Aerospace and Defense | 1.30 | |
| Data Patterns (India) Ltd. | 1.30 | |
| Consumer Durables | 1.16 | |
| Titan Company Ltd. | 1.05 | |
| AMBER ENTERPRISES INDIA LTD. | 0.11 | |
| Agricultural Food and other Product | 1.14 | |
| Marico Ltd. | 1.14 | |
| Commercial Services and Supplies | 1.14 | |
| Redington India Ltd | 1.14 | |
| Cement and Cement Products | 1.07 | |
| Grasim Industries Ltd. | 1.07 | |
| Consumable Fuels | 1.04 | |
| Coal India Ltd. | 1.04 | |
| Petroleum Products | 0.97 | |
| Chennai Petroleum Corporation Ltd. | 0.97 | |
| Non - Ferrous Metals | 0.95 | |
| Hindalco Industries Ltd | 0.46 | |
| NATIONAL ALUMINIUM COMPANY LTD | 0.33 | |
| HINDUSTAN COPPER LTD. | 0.09 | |
| HINDUSTAN ZINC LTD. | 0.07 | |
| Minerals and Mining | 0.75 | |
| NMDC Ltd. | 0.75 | |
| Telecom - Equipment and Accessories | 0.59 | |
| STERLITE TECHNOLOGIES LTD | 0.59 | |
| Agricultural, Commercial and Constr | 0.11 | |
| TML COMMERCIAL VEHICLES LIMITED | 0.11 | |
| Diversified Metals | 0.10 | |
| Vedanta Ltd. | 0.10 | |
| Equity & Equity related - Total | 98.48 | |
| Mutual Fund Units | ||
| Kotak Liquid Direct Growth | Mutual Fund | 0.14 |
| Mutual Fund Units - Total | 0.14 | |
| Triparty Repo | 1.37 | |
| Net Current Assets/(Liabilities) | 0.01 | |
| Grand Total | 100.00 | |
| | ||
** non-traded securities - Fair value as determined by Kotak Mahindra Asset Management Company Limited in accordance with guidelines on valuation of securities for mutual funds issued by the Securities and Exchange board of India and approved by the Trustees.

| Monthly SIP of (₹) 10000 | Since Inception | 3 Years | 1 Year |
| Total amount invested (₹) | 3,80,000 | 3,60,000 | 1,20,000 |
| Total Value as on Sep 30, 2026 (₹) | 3,99,051 | 3,70,021 | 1,16,860 |
| Scheme Returns (%) | 3.04 | 1.79 | -4.84 |
| Nifty 200 (TRI) Returns (%) | 1.99 | 1.11 | -9.09 |
| Alpha* | 1.05 | 0.69 | 4.25 |
| Nifty 200 (TRI) (₹)# | 3,92,413 | 3,66,156 | 1,14,056 |
| Nifty 50 (TRI) (₹)^ | 3,76,249 | 3,52,171 | 1,11,040 |
| Nifty 50 (TRI) Returns (%) | -0.61 | -1.42 | -13.60 |
| Regular | Direct | |
| Growth | Rs14.5800 | Rs14.7710 |
| IDCW | Rs14.4690 | Rs14.7710 |
A) Regular Plan B) Direct Plan
Options: Growth and Income Distribution
cum capital withdrawal (IDCW) (Payout and
Reinvestment)
| Fund Manager* | Mr. Harsha Upadhyaya, Mr. Rohit Tandon & Mr. Abhishek Bisen |
| Benchmark | Nifty 200 TRI |
| Allotment date | August 02, 2023 |
| AAUM | Rs474.27 crs |
| AUM | Rs451.20 crs |
| Folio count | 14,261 |
Trustee's Discretion
| Portfolio Turnover | 182.22% |
| $Beta | 1.07 |
| $Sharpe ## | 0.44 |
| $Standard Deviation | 17.74% |
| ^^(P/E) | 25.12 |
| ^^P/BV | 4.64 |
| Large Cap | 34.18% |
| Mid Cap | 32.64% |
| Small Cap | 31.66% |
| Debt & Money Market | 1.52% |
*% of Net Asset
Initial Investment
• Rs5000 and in multiples of Rs1 for
purchases and of Rs0.01 for switches
Additional Investment
• Rs1000 and in multiples of Rs1 for
purchases and of Rs0.01 for switches
Systematic Investment Plan (SIP)
• Rs500 (Subject to a minimum of 10 SIP
installments of Rs500/- each)
• 5 years & above
Entry Load: Nil. (applicable for all plans)
Exit Load:
• For redemption / switch out within 90
days from the date of allotment: 0.5%
• If units are redeemed or switched out on
or after 90 days from the date of allotment -
Nil.
| Regular Plan: | 1.86% |
| Direct Plan: | 1.18% |
Folio Count data as on 31st August 2026.
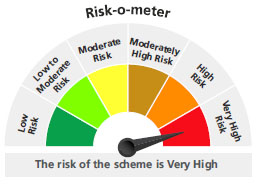
Benchmark : Nifty 200 TRI
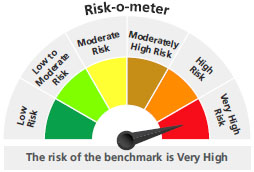
This product is suitable for investors who are seeking*:
- Long term capital growth
- Investment predominantly in equity & equity related instruments selected based on quant model
* Investors should consult their financial advisors if in doubt about whether the product is suitable for them.
For latest Riskometer, investors may refer to an addendum issued or updated on website at www.kotakmf.com
* For Fund Manager experience, please refer 'For Regular Plan' & 'For Direct Plan'
For scheme performance, please refer 'For Regular Plan' & 'For Direct Plan'