An open-ended equity scheme investing in Multi-national Companies (MNC) theme
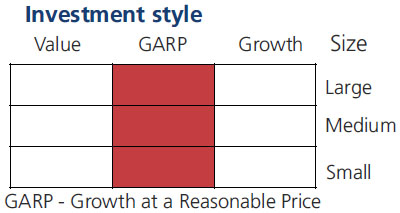
An open-ended equity scheme investing in Multi-national Companies (MNC) theme
 |
 |
  
|
|
|
|
The investment objective of the scheme is to generate long-term capital appreciation from a portfolio that is invested predominantly in equity and equity related securities of multi-national companies (MNC). However, there is no assurance that the objective of the scheme will be achieved.
The investment objective of the scheme is to generate long-term capital appreciation from a portfolio that is invested predominantly in equity and equity related securities of multi-national companies (MNC). However, there is no assurance that the objective of the scheme will be achieved.
| Issuer/Instrument | |
% to Net Assets |
|---|---|---|
| Equity & Equity related | ||
| Pharmaceuticals and Biotechnology | 18.05 | |
| ACUTAAS CHEMICALS LTD | 4.38 | |
| Sun Pharmaceuticals Industries Ltd. | 3.23 | |
| Divi s Laboratories Ltd. | 2.98 | |
| Marksans Pharma Ltd | 2.87 | |
| VIYASH SCIENTIFIC LTD. | 1.30 | |
| ANTHEM BIOSCIENCES LTD | 1.19 | |
| ORCHID PHARMA LTD. | 1.15 | |
| SAI LIFE SCIENCES LIMITED | 0.95 | |
| Electrical Equipment | 16.01 | |
| MTAR TECHNOLOGIES LTD. | 4.86 | |
| AZAD ENGINEERING LTD | 4.35 | |
| GE VERNOVA T&D INDIA LIMITED | 3.37 | |
| Siemens Ltd. | 1.88 | |
| ABB INDIA LTD | 1.55 | |
| Auto Components | 11.15 | |
| SAMVARDHANA MOTHERSON INTERNATIONAL LIMITED | 3.05 | |
| ZF Commercial Vehicle Control Systems India Limited | 2.04 | |
| Schaeffler India Ltd | 2.03 | |
| TENNECO CLEAN AIR INDIA LIMITED | 1.89 | |
| Igarashi Motors India Ltd. | 1.17 | |
| HERO MOTORS LIMITED | 0.97 | |
| Food Products | 6.44 | |
| Britannia Industries Ltd. | 3.23 | |
| NESTLE INDIA LTD. | 3.21 | |
| Automobiles | 5.91 | |
| Maruti Suzuki India Limited | 3.20 | |
| HYUNDAI MOTORS INDIA LTD | 2.71 | |
| Aerospace and Defense | 4.76 | |
| AXISCADES TECHNOLOGIES LTD | 2.48 | |
| ROSSELL TECHSYS LTD. | 2.28 | |
| Industrial Manufacturing | 4.70 | |
| INDO-MIM LTD | 4.70 | |
| Capital Markets | 4.36 | |
| NIPPON LIFE INDIA ASSET MANAGEMENT LTD. | 2.29 | |
| Aditya Birla Sun Life AMC Ltd | 1.77 | |
| SBI FUNDS MANAGEMENT LIMITED | 0.30 | |
| Industrial Products | 3.74 | |
| Cummins India Ltd. | 2.12 | |
| Grindwell Norton Ltd. | 1.62 | |
| Diversified FMCG | 3.35 | |
| Hindustan Unilever Ltd. | 3.35 | |
| IT - Software | 3.31 | |
| ORACLE FINANCIAL SERVICES SOFTWARE LTD | 3.31 | |
| Healthcare Services | 2.84 | |
| Fortis Healthcare India Ltd | 1.51 | |
| ASTER DM HEALTHCARE LTD | 1.33 | |
| Agricultural, Commercial and Constr | 2.75 | |
| ASHOK LEYLAND LTD. | 2.75 | |
| Beverages | 2.47 | |
| UNITED SPIRITS LTD. | 2.47 | |
| Diversified Metals | 1.73 | |
| Vedanta Ltd. | 1.73 | |
| Textiles and Apparels | 1.37 | |
| Garware Technical Fibres Ltd. | 1.37 | |
| IT - Services | 1.26 | |
| TATA TECHNOLOGIES LTD | 1.26 | |
| Non - Ferrous Metals | 1.26 | |
| Hindalco Industries Ltd | 1.26 | |
| Finance | 1.24 | |
| APTUS VALUE HOUSING FINANCE | 1.24 | |
| Fertilizers and Agrochemicals | 1.03 | |
| P I INDUSTRIES LTD | 1.03 | |
| Consumer Durables | 0.94 | |
| MIDWEST LTD. | 0.94 | |
| Banks | 0.88 | |
| IndusInd Bank Ltd. | 0.88 | |
| Equity & Equity related - Total | 99.55 | |
| Triparty Repo | 0.94 | |
| Net Current Assets/(Liabilities) | -0.49 | |
| Grand Total | 100.00 | |
| | ||

| Monthly SIP of Rs 10000 | Since Inception | 1 Year |
| Total amount invested (Rs) | 2,50,000 | 1,20,000 |
| Total Value as on Sep 30, 2026 (Rs) | 2,94,981 | 1,31,801 |
| Scheme Returns (%) | 17.17 | 18.81 |
| Nifty MNC Index Returns (%) | 4.46 | -3.04 |
| Alpha* | 12.71 | 21.86 |
| Nifty MNC Index (TRI) (Rs)# | 2,61,439 | 1,18,030 |
| Nifty 50 (TRI) (Rs)^ | 2,35,187 | 1,11,040 |
| Nifty 50 (TRI) Returns (%) | -5.87 | -13.60 |
| Regular | Direct | |
| Growth | Rs12.2820 | Rs12.6250 |
| IDCW | Rs12.2820 | Rs12.6260 |
A) Regular Plan B) Direct Plan
Options: Growth and Income Distribution
cum capital withdrawal (IDCW) (Payout and
Reinvestment)
| Fund Manager* |
Mr. Harsha Upadhyaya, Mr. Dhananjay Tikariha & Mr. Abhishek Bisen |
| Benchmark | Nifty MNC Index TRI |
| Allotment date | October 28, 2024 |
| AAUM | Rs2,269.33 crs |
| AUM | Rs2,246.36 crs |
| Folio count | 1,08,384 |
Trustee's Discretion
| Portfolio Turnover | 49.40% |
| $Beta | 0.90 |
| $Sharpe ## | 0.39 |
| $Standard Deviation | 18.01% |
| ^^(P/E) | 44.29 |
| ^^P/BV | 7.50 |
| Large Cap | 33.50% |
| Mid Cap | 22.16% |
| Small Cap | 43.89% |
| Debt & Money Market | 0.45% |
*% of Net Asset
Initial & Additional Investment
• Rs100 and any amount thereafter
Systematic Investment Plan (SIP)
• Rs 100 and any amount thereafter
• 5 years & above
Entry Load: Nil. (applicable for all plans)
Exit Load:
• For redemption / switch out within 90
days from the date of allotment: 0.5%
• If units are redeemed or switched out on
or after 90 days from the date of allotment -
Nil
(With effect from 30th Dec 2024)
| Regular Plan: | 2.04% |
| Direct Plan: | 0.67% |
Folio Count data as on 31st August 2026.
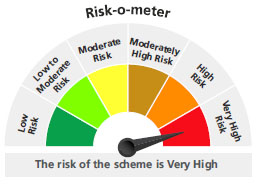
Benchmark : Nifty MNC Index TRI
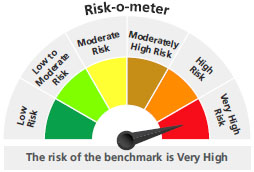
This product is suitable for investors who are seeking*:
- Long-term capital growth
- Investment in portfolio of predominantly in equity and equity related securities of multi-national companies (MNC).
* Investors should consult their financial advisors if in doubt about whether the product is suitable for them.
For latest Riskometer, investors may refer to an addendum issued or updated on website at www.kotakmf.com
* For Fund Manager experience, please refer 'For Regular Plan' & 'For Direct Plan'
For scheme performance, please refer 'For Regular Plan' & 'For Direct Plan'