(ERSTWHILE KNOWN AS KOTAK EMERGING EQUITY FUND)
Mid Cap Fund - An open ended equity scheme predominantly investing in mid cap stocks
(ERSTWHILE KNOWN AS KOTAK EMERGING EQUITY FUND)
Mid Cap Fund - An open ended equity scheme predominantly investing in mid cap stocks
 |
 |
  
|
|
|
|
| Issuer/Instrument | |
% to Net Assets |
|---|---|---|
| Equity & Equity related | ||
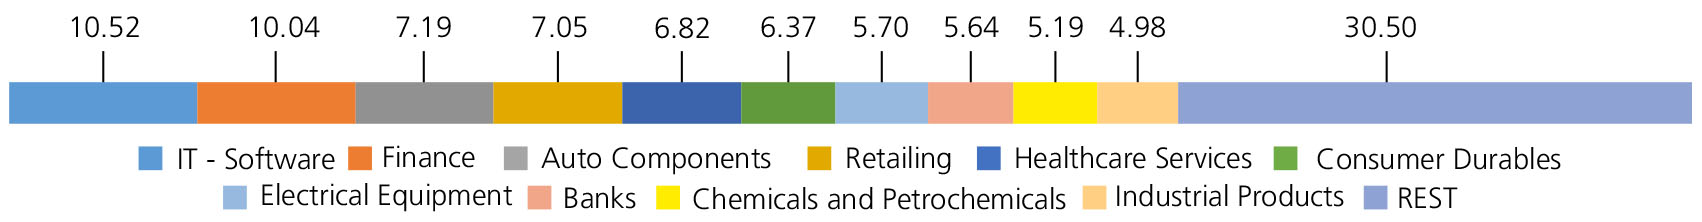
| IT - Software | 10.52 | |
| Mphasis Ltd | 3.58 | |
| PERSISTENT SYSTEMS LIMITED | 2.04 | |
| Oracle Financial Services Software Ltd | 1.94 | |
| Wipro Ltd. | 1.64 | |
| Birlasoft Ltd. | 1.32 | |
| Finance | 10.04 | |
| L&T FINANCE HOLDINGS LTD | 2.18 | |
| Cholamandalam Investment and Finance Company Ltd. | 1.96 | |
| HDB FINANCIAL SERVICES LTD | 1.95 | |
| Power Finance Corporation Ltd. | 1.45 | |
| INDIA SHELTER FINANCE CORPORATION LTD | 0.69 | |
| POONAWALLA FINCORP LTD. | 0.67 | |
| HOME FIRST FINANCE CO INDIA | 0.66 | |
| REC LTD | 0.48 | |
| Auto Components | 7.19 | |
| Schaeffler India Ltd | 1.86 | |
| UNO MINDA LIMITED | 1.30 | |
| MRF Limited | 1.21 | |
| Bharat Forge Ltd. | 1.02 | |
| Apollo Tyres Ltd. | 0.92 | |
| ZF Commercial Vehicle Control Systems India Limited | 0.88 | |
| Retailing | 7.05 | |
| VISHAL MEGA MART LIMITED | 2.49 | |
| SWIGGY LTD | 2.41 | |
| ETERNAL LIMITED | 1.55 | |
| LENSKART SOLUTIONS LIMITED | 0.60 | |
| Healthcare Services | 6.82 | |
| Fortis Healthcare India Ltd | 3.60 | |
| Global Health Ltd. | 1.65 | |
| MAX HEALTHCARE INSTITUTE LTD. | 0.92 | |
| ASTER DM HEALTHCARE LTD | 0.65 | |
| Consumer Durables | 6.37 | |
| Dixon Technologies India Ltd. | 2.20 | |
| BLUE STAR LTD. | 1.51 | |
| Metro Brands Ltd. | 1.41 | |
| VOLTAS LTD. | 1.17 | |
| V-Guard Industries Ltd. | 0.08 | |
| Electrical Equipment | 5.70 | |
| GE VERNOVA T&D INDIA LIMITED | 4.21 | |
| Apar Industries Limited | 1.49 | |
| Banks | 5.64 | |
| INDIAN BANK | 2.41 | |
| FEDERAL BANK LTD. | 1.55 | |
| BANK OF MAHARASHTRA | 1.11 | |
| Bank Of Baroda | 0.57 | |
| Chemicals and Petrochemicals | 5.19 | |
| SRF Ltd. | 2.06 | |
| SOLAR INDUSTRIES INDIA LIMITED | 1.99 | |
| Deepak Nitrite Ltd. | 1.14 | |
| Industrial Products | 4.98 | |
| KEI INDUSTRIES LTD. | 2.38 | |
| Polycab India Ltd. | 0.98 | |
| APL APOLLO TUBES LTD. | 0.88 | |
| Ratnamani Metals & Tubes Ltd. | 0.74 | |
| Pharmaceuticals and Biotechnology | 4.64 | |
| Ipca Laboratories Ltd. | 2.81 | |
| JB CHEMICALS & PHARMACEUTICALS LTD. | 1.45 | |
| RUBICON RESEARCH LTD | 0.24 | |
| RUBICON RESEARCH LTD (PRE IPO) | 0.14 | |
| Capital Markets | 4.15 | |
| NUVAMA WEALTH MANAGEMENT LIMITED | 1.47 | |
| Nippon Life India Asset Management Ltd. | 0.99 | |
| BSE LTD. | 0.89 | |
| Prudent Corporate Advisory Services Ltd. | 0.80 | |
| Cement and Cement Products | 3.70 | |
| JK Cement Ltd. | 2.21 | |
| Dalmia Bharat Limited | 1.49 | |
| Fertilizers and Agrochemicals | 3.68 | |
| Coromandel International Ltd. | 2.14 | |
| P I Industries Ltd | 1.54 | |
| Insurance | 2.89 | |
| Max Financial Services Ltd. | 1.51 | |
| ICICI Lombard General Insurance Company Ltd | 1.38 | |
| Telecom - Services | 2.23 | |
| BHARTI HEXACOM LTD. | 2.23 | |
| Aerospace and Defense | 2.21 | |
| Bharat Electronics Ltd. | 2.21 | |
| Realty | 2.21 | |
| Oberoi Realty Ltd | 2.21 | |
| Petroleum Products | 2.00 | |
| HINDUSTAN PETROLEUM CORPORATION LTD | 2.00 | |
| Ferrous Metals | 0.90 | |
| Jindal Steel & Power Ltd. | 0.90 | |
| Construction | 0.45 | |
| TECHNO ELECTRIC & ENGINEERING COMPANY LIMITED | 0.45 | |
| Personal Products | 0.44 | |
| Emami Ltd. | 0.44 | |
| Equity & Equity related - Total | 99.00 | |
| Mutual Fund Units | ||
| Kotak Liquid Direct Growth | 0.18 | |
| Mutual Fund Units - Total | 0.18 | |
| Triparty Repo | 0.80 | |
| Net Current Assets/(Liabilities) | 0.02 | |
| Grand Total | 100.00 | |
| Monthly SIP of (₹) 10000 | Since Inception | 10 years | 7 years | 5 years | 3 years | 1 year |
| Total amount invested (₹) | 22,60,000 | 12,00,000 | 8,40,000 | 6,00,000 | 3,60,000 | 1,20,000 |
| Total Value as on Dec 31, 2025 (₹) | 1,59,05,388 | 32,91,885 | 18,24,522 | 9,56,194 | 4,65,123 | 1,27,476 |
| Scheme Returns (%) | 18.07 | 19.16 | 21.77 | 18.70 | 17.36 | 11.75 |
| Nifty Midcap 150 (TRI) Returns (%) | 17.98 | 20.14 | 23.34 | 20.49 | 18.66 | 15.97 |
| Alpha* | 0.09 | -0.98 | -1.57 | -1.79 | -1.30 | -4.22 |
| Nifty Midcap 150 (TRI) (₹)# | 1,57,32,431 | 34,70,339 | 19,28,971 | 9,98,772 | 4,73,748 | 1,30,098 |
| Nifty Midcap 100 (TRI) Returns (%) | 16.90 | 19.63 | 23.71 | 21.24 | 19.47 | 16.61 |
| Alpha* | 1.17 | -0.47 | -1.94 | -2.54 | -2.10 | -4.86 |
| Nifty Midcap 100 (TRI) (₹)# | 1,38,83,173 | 33,76,348 | 19,54,339 | 10,17,082 | 4,79,097 | 1,30,495 |
| Nifty 50 (TRI) (₹)^ | 88,51,590 | 25,66,519 | 14,46,126 | 8,38,962 | 4,38,641 | 1,29,514 |
| Nifty 50 (TRI) Returns (%) | 12.97 | 14.54 | 15.24 | 13.37 | 13.26 | 15.02 |
| Regular | Direct | |
| Growth | Rs136.5880 | Rs158.8343 |
| IDCW | Rs75.0179 | Rs94.6312 |
A) Regular Plan B) Direct Plan
Options: Payout of IDCW, Reinvestment of
IDCW & Growth (applicable for all plans)
| Fund Manager* |
Mr. Atul Bhole |
| Benchmark*** | NIFTY Midcap 150 TRI (Tier 1), Nifty Midcap 100 TRI (Tier 2) |
| Allotment date | March 30, 2007 |
| AAUM | Rs60,081.55 crs |
| AUM | Rs60,636.84 crs |
| Folio count | 20,85,938 |
Trustee's Discretion
| Portfolio Turnover | 23.67% |
| $Beta | 0.89 |
| $Sharpe ## | 1.00 |
| $Standard Deviation | 15.04% |
| ^^(P/E) | 35.78 |
| ^^P/BV | 5.05 |
| Large Cap | 13.67% |
| Mid Cap | 70.50% |
| Small Cap | 14.83% |
| Debt & Money Market | 1.00% |
*% of Net Asset
Initial & Additional Investment
• Rs100 and any amount thereafter
Systematic Investment Plan (SIP)
• Rs 100 and any amount thereafter
• 5 years & above
Entry Load: Nil. (applicable for all plans)
Exit Load:
• For redemption / switch out of upto 10%
of the initial investment amount (limit)
purchased or switched in within 1 year from
the date of allotment: Nil.
• If units redeemed or switched out are in
excess of the limit within 1 year from the
date of allotment: 1%
• If units are redeemed or switched out on
or after 1 year from the date of allotment:
NIL.
| Regular Plan: | 1.38% |
| Direct Plan: | 0.37% |
Folio Count data as on 30th November 2025.
Benchmark - Tier 1: Nifty Midcap 150 TRI
Benchmark - Tier 2: Nifty Midcap 100 TRI
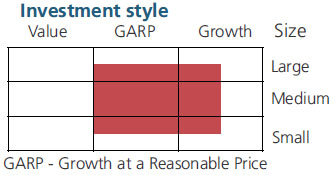
This product is suitable for investors who are seeking*:
- Long term capital growth
- Investment in equity & equity related securities predominantly in mid cap companies.
* Investors should consult their financial advisors if in doubt about whether the product is suitable for them.
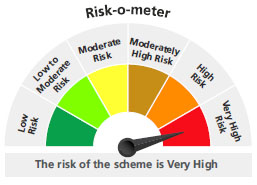
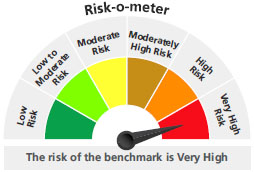
For latest Riskometer, investors may refer to an addendum issued or updated on website at www.kotakmf.com
***As per para 1.9 of of SEBI Master circular No. SEBI/HO/IMD/IMD-PoD-1/P/CIR/2024/90 dated June 27, 2024 The first tier benchmark is reflective of the category of the scheme and the second tier benchmark is demonstrative of the investment style / strategy of the Fund Manager within the category.
## Risk rate assumed to be 5.67% (FBIL Overnight MIBOR rate as on 31st Dec 2025).**Total Expense Ratio includes applicable GST.
* For Fund Manager experience, please refer 'For Regular Plan' & 'For Direct Plan'
For last three IDCW, please refer 'Dividend History'.
For scheme performance, please refer 'For Regular Plan' & 'For Direct Plan'