29 Jun 2026
In investment analysis, performance figures can often look very different depending on how they are measured. Trailing returns offer a simple point to point view of how an investment has performed over a fixed period, while rolling returns provide a more dynamic picture by showing how returns behave across multiple overlapping time frames. Both are widely used in evaluating mutual funds and other investments in India, but they answer different questions. Understanding the difference between them is important because relying on just one can sometimes lead to incomplete or even misleading conclusions about an investment’s true consistency and quality.
Key Takeaways
- Trailing returns show point to point historical performance over a fixed period.
- Rolling returns show performance consistency across multiple time periods.
- Trailing returns are simple but can be biased by timing effects.
- Rolling returns provide a more stable and realistic performance view.
- Neither metric is sufficient alone for investment decisions.
- A combination of trailing returns, rolling returns and risk-adjusted measures gives a more complete analysis.
- Consistency across market cycles is often more important than short-term outperformance.
What Are Trailing Returns?
Trailing returns refer to the performance of an investment measured over a defined period by comparing its value at the start of that period with its value at the end. It shows the actual rise or fall in value that has already taken place within that timeframe.
This measure is purely historical in nature. It does not attempt to predict future performance but instead focuses only on what has already happened. Depending on the selected time period, such as one year, three years or five years, it presents a clear picture of how the investment has performed over that specific duration.
How to Calculate Trailing Return?
For example, assume an investment was worth 10,000 at the beginning of a three year period and grows to 13,500 by the end of it.
1) Absolute Return

- Total Gain=13,500−10,000 = 3,500
- Total Return=3,500/10,000 = 0.35 = 35%
2) Annualized Return (CAGR - Compound Annual Growth Rate)
To convert the total return into an annualized figure, we use the CAGR formula
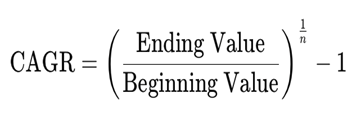
Where:
- Ending Value = 13,500
- Beginning Value = 10,000
- n = 3 years
CAGR = (13,500/10,000)^(1/3) −1 = 10.5%
What Are Rolling Returns?
Rolling returns measure the annualized performance of an investment across multiple overlapping time periods within a given time horizon. Unlike traditional point to point returns, which are calculated between one fixed start date and end date, rolling returns are computed by moving the investment window forward at regular intervals (such as daily, monthly or yearly). This produces a series of return figures for the same holding period length.
How to Calculate Rolling Returns?
To calculate rolling returns, a systematic and repeated approach is used over a continuous dataset
- Select a time horizon: Choose the investment period to evaluate, such as 1-year, 3-year or 5-year returns.
- Compute the return for the selected period: Calculate the annualized return for the first full window within the dataset.
- Shift the time window forward: Move the calculation period forward at regular intervals (daily, monthly or yearly), depending on the analysis requirement.
- Repeat the process: Continue calculating returns for each overlapping period across the entire dataset.
Rolling Returns vs Trailing Returns - Key Differences
| Aspect | Trailing Returns | Rolling Returns |
|---|---|---|
| Time Horizon | Calculated over a fixed period ending on a specific date | Calculated over multiple overlapping time periods |
| Nature of View | Provides a point in time snapshot of performance | Provides a continuous and evolving view of performance |
| Reliability | Can be influenced by the selected start or end date | Offers a more balanced and less biased assessment |
| Performance Insight | Shows return for a single selected period | Shows how returns vary across different market phases |
| Purpose | Suitable for quick reference and comparison | Suitable for detailed performance evaluation |
| Risk Insight | Limited understanding of consistency and volatility | Better reflection of consistency and risk behavior |
Fund A vs Fund B - Why Trailing Returns Can Mislead
| Year | Fund A Return | Fund B Return |
|---|---|---|
| Year 1 | 2% | 10% |
| Year 2 | 3% | 11% |
| Year 3 | 4% | 10% |
| Year 4 | 25% | 12% |
| Year 5 | 30% | 11% |
Trailing Return (5-Year Annualized Return)
- Fund A: ~12.2%
- Fund B: ~10.9%
At first glance, Fund A looks better because it shows a higher trailing return. This is often what investors notice when they look at Net Asset Value growth charts over the last few years, without realizing how uneven that growth actually is.
What Actually Happened
Fund A:
- Most returns came in the last 2 years (25% and 30%)
- Earlier years were weak (2%–4%)
- Performance is uneven and dependent on recent market rally
Fund B:
- Delivered stable returns every year (around 10%–12%)
- No extreme spikes or drops
- Consistent performance across all market conditions
When Should You Use Trailing Returns?
Trailing returns are useful when you want a quick snapshot of performance over a specific past period. They are especially helpful for:
- Getting a quick overview of how an investment has performed recently
- Comparing different funds or assets over the same time period
- Evaluating recent historical results in a simple and standardized way
While trailing returns are easy to understand and widely used, they should not be the sole basis for investment decisions. They work best when combined with risk-adjusted measures.
When Should You Use Rolling Returns?
Rolling returns are useful when you want to measure performance across multiple overlapping time periods instead of a single fixed start and end date. They are best used for
- Checking consistency of returns over time
- Comparing long-term performance between funds or assets
- Evaluating the stability and reliability of returns
- Understanding how an investment performs across different market cycles
Rolling returns help remove the bias of choosing a specific start or end date and give a more complete view of performance.
How to Analyse Rolling Returns Like a Pro?
To effectively use rolling returns, focus on how performance behaves across different time periods and market conditions:
- Examine the average rolling returns to understand typical performance
- Review the worst case rolling returns to assess downside risk
- Observe maximum rolling returns to understand upside variation
- Compare results against relevant benchmark indices
- Evaluate consistency across different market cycles (bull and bear phases)
A fund that delivers stable performance across different market environments is generally considered more reliable and less dependent on favorable timing.
Limitations of Both Metrics
1)Trailing Returns - Limitations
- Highly dependent on the selected start and end dates
- Can be misleading during volatile market periods
- Does not reflect return consistency over time
2) Rolling Returns - Limitations
- More complex to calculate and interpret
- Requires extensive historical data
- Not readily available on all investment platforms
Because each metric has its own limitations, investors should use both trailing and rolling returns together to get a more balanced view of performance rather than relying on just one measure. However, to calculate your sip returns, XIRR is more appropriate as it accounts for the timing and size of cash flows and provides a more accurate reflection of actual returns.
Conclusion
Trailing returns and rolling returns are both widely used in mutual fund analysis, but they serve different purposes. Trailing returns provide a simple point to point snapshot of performance over a specific period, making them useful for quick comparisons. However, they can sometimes be influenced by the chosen start and end dates, which may not fully reflect consistency. Rolling returns, on the other hand, give a more complete and reliable view by showing how a fund performs across multiple overlapping time periods and different market cycles. This makes them better suited for understanding consistency and long term performance quality.
FAQs
1) How are rolling returns calculated?
Rolling returns are calculated by selecting a fixed time horizon such as one year or three years and repeatedly computing returns while shifting the time window forward across historical data.
2) Where can I find rolling returns for mutual funds?
Rolling returns can be found on mutual fund research platforms, fund house websites and financial analytics tools that provide advanced performance data.
3) Can rolling returns predict future performance?
No, rolling returns cannot predict future performance. However, they help evaluate the consistency and stability of past returns, which can support better investment decisions.
Disclaimers
Investors may consult their Financial Advisors and/or Tax advisors before making any investment decision.
These materials are not intended for distribution to or use by any person in any jurisdiction where such distribution would be contrary to local law or regulation. The distribution of this document in certain jurisdictions may be restricted or totally prohibited and accordingly, persons who come into possession of this document are required to inform themselves about, and to observe, any such restrictions.
MUTUAL FUND INVESTMENTS ARE SUBJECT TO MARKET RISKS, READ ALL SCHEME RELATED DOCUMENTS CAREFULLY.